Hello,
I am able to create a simple descriptive table using describe function. But it is not digging enough to show the statistic results within each variable. Like if my data set has gender, political party, education, etc. I want to see the statistic results for gender (male and female), for political party (republican, democrat, other), and for education (no education, hs, college, etc.). This information could help with understand the Mean and SD within each variable with more accuracy.
Can you provide with an example on how to accomplish this goal?
It does not make sense to calculate the mean of a variable that consists of categories. If you have 27 republicans, 29 democrats, and 2 other, how would you calculate a mean? The Hmisc::describe() function does give you the count and the proportion in each category.
The mean and standard deviation of mpg and qsec for automatic (am=0) and manual (am=1) transmissions, then the same for the number of cyclinders (4, 6, 8)
Are you trying to find the mean and standard deviation of some other variable grouped by gender or political party? If so, look at @EconProf's use of group_by().
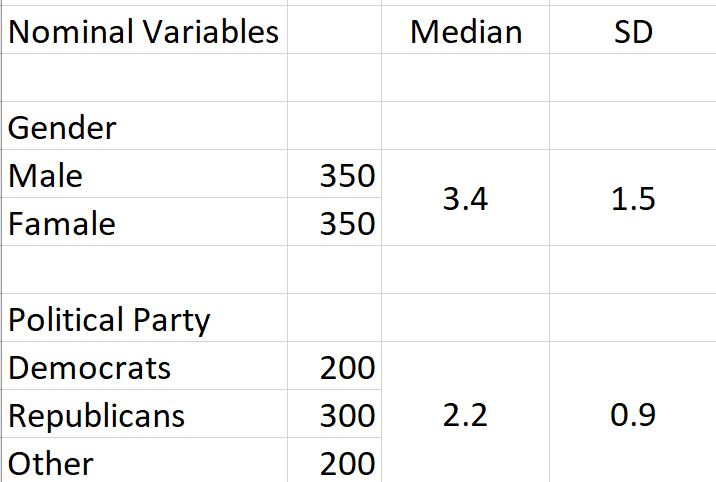
The table of what you want to achieve does not make sense to me. For gender, instead of finding the differences in the median (not mean?) and standard deviation for males and females, you have just one value of the median and one of the standard deviation for males and females combined.
You also give no indication of what variable you are calculating the median and standard deviation for. If you have a median of 3.4 for that variable for 700 cases (350 male and 350 female) then there should be a median of 3.4 for the same 700 cases (200 democrats, 300 republicans and 200 others).
It would be very helpful if you could provide a reprex with a sample of your data and any R code you have tried so far.
The information on the table is just for illustration, and is not even accurate. But, you are correct. On my data analysis, it would make sense to extract additional information from like "political party", and "ideology". So the end result does not sound so bias.
Suppose that I wanted to calculate the mean and standard deviation of mpg for cars with 4, 6 and 8 cylinders. Given that I am only doing this for one variable, mpg, the code is simpler than shown in my earlier post.
It might also be helpful to have a count for each category (e.g., how many males and females). For my example, there 11 cars with 4 cylinders, 7 with 6 cylinders and 14 with 8.
If you want one table with the results for all groupings (gender, political_party, education), I am not sure of the best way. Perhaps someone else has an idea.