Display numeric values in 3 line graph

Hello everybody,

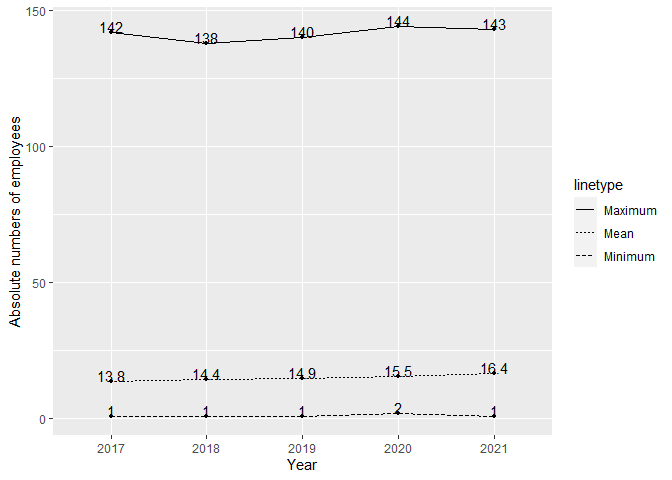
for the dataset below, I want to display the respective numeric values on the points in a 3 line graph. However, every attempt to include geom_text() into my code, leads to an error of missing y.
I´ll be very greatful for any help, how and where to include this element!!!

ggplot(df_Empl_MinMeanMax, aes(df_Empl_MinMeanMax$Year, group=3)) +
geom_line(aes(y = df_Empl_MinMeanMax$Minimum, linetype = "Minimum"), show_guide=TRUE) +
geom_point(aes(y = df_Empl_MinMeanMax$Minimum), size = 1) +
geom_line(aes(y = df_Empl_MinMeanMax$Mean, linetype = "Mean"), show_guide=TRUE) +
geom_point(aes(y = df_Empl_MinMeanMax$Mean), size = 1) +
geom_line(aes(y = df_Empl_MinMeanMax$Maximum, linetype = "Maximum"), show_guide=TRUE) +
geom_point(aes(y = df_Empl_MinMeanMax$Maximum), size = 1) +
scale_colour_manual(name="Minimum, Mean and Maximum of Employees 2017-2021")+
labs(x="Year", y="Absolute numbers of employees")

data.frame(
stringsAsFactors = FALSE,
row.names = c("2017", "2018", "2019", "2020", "2021"),
Minimum = c(1, 1, 1, 2, 1),
Mean = c(13.7884615384615,
14.421568627451,14.87,15.5360824742268,16.4347826086957),
Maximum = c(142, 138, 140, 144, 143),
Years = c("2017", "2018", "2019", "2020", "2021"),
Year = c("2017", "2018", "2019", "2020", "2021")
)

Here are two ways to plot your data with the points labeled with the y values. Notice that I dropped all instances of df_Empl_MinMeanMax$ which are unnecessary.

df_Empl_MinMeanMax = data.frame(
  stringsAsFactors = FALSE,
  row.names = c("2017", "2018", "2019", "2020", "2021"),
  Minimum = c(1, 1, 1, 2, 1),
  Mean = c(13.7884615384615,
           14.421568627451,14.87,15.5360824742268,16.4347826086957),
  Maximum = c(142, 138, 140, 144, 143),
  Years = c("2017", "2018", "2019", "2020", "2021"),
  Year = c("2017", "2018", "2019", "2020", "2021")
)

library(tidyr)
library(ggplot2)
ggplot(df_Empl_MinMeanMax, aes(Year, group=3)) +
  geom_line(aes(y = Minimum, linetype = "Minimum"), show_guide=TRUE) +
  geom_point(aes(y = Minimum), size = 1) +
  geom_line(aes(y = Mean, linetype = "Mean"), show_guide=TRUE) +
  geom_point(aes(y = Mean), size = 1) +
  geom_line(aes(y = Maximum, linetype = "Maximum"), show_guide=TRUE) +
  geom_point(aes(y = Maximum), size = 1) +
  geom_text(aes(y = Minimum, label = Minimum), vjust = 0) +
  geom_text(aes(y = Mean, label = round(Mean,1)), vjust = 0) +
  geom_text(aes(y = Maximum, label = Maximum), vjust = 0) +
  scale_colour_manual(name="Minimum, Mean and Maximum of Employees 2017-2021")+
  labs(x="Year", y="Absolute numbers of employees")
#> Warning: `show_guide` has been deprecated. Please use `show.legend` instead.
#> `show_guide` has been deprecated. Please use `show.legend` instead.


LongData <- df_Empl_MinMeanMax |>
  pivot_longer(Minimum:Maximum, names_to = "Stat", values_to = "Value")
LongData
#> # A tibble: 15 × 4
#>    Years Year  Stat    Value
#>    <chr> <chr> <chr>   <dbl>
#>  1 2017  2017  Minimum   1  
#>  2 2017  2017  Mean     13.8
#>  3 2017  2017  Maximum 142  
#>  4 2018  2018  Minimum   1  
#>  5 2018  2018  Mean     14.4
#>  6 2018  2018  Maximum 138  
#>  7 2019  2019  Minimum   1  
#>  8 2019  2019  Mean     14.9
#>  9 2019  2019  Maximum 140  
#> 10 2020  2020  Minimum   2  
#> 11 2020  2020  Mean     15.5
#> 12 2020  2020  Maximum 144  
#> 13 2021  2021  Minimum   1  
#> 14 2021  2021  Mean     16.4
#> 15 2021  2021  Maximum 143
ggplot(LongData, aes(Year, Value, linetype = Stat, group = Stat)) +
  geom_point(size = 1) + geom_line() +
  geom_text(aes(label = round(Value,1)), vjust = 0) +
  labs(x="Year", y="Absolute numbers of employees")

Created on 2023-04-02 with reprex v2.0.2

2 Likes

Thank you so much @FJCC for your immediate help!

This topic was automatically closed 42 days after the last reply. New replies are no longer allowed.

If you have a query related to it or one of the replies, start a new topic and refer back with a link.