I have been trying to run the following code, to analyse the simple main effect :
em <- emmeans(data, "var1", by = "var2") %>%
as.data.frame() %>%
pairs() %>%
update(by = NULL, adjust = "holm")
I keep getting the follwing error:
Error in h(simpleError(msg, call)) :
error in evaluating the argument 'object' in selecting a method for function 'update': Can't handle an object of class “tbl_df”
Use help("models", package = "emmeans") for information on supported models.
The type of my data is "tbl_df". I am for some reason also unable to change it into 'data.frame'.
I am still quite new to R, would appreciate any help, thank you!
Hi @julkakulka,
Welcome to the Posit/RStudio Community Forum.
Here are some changes to your code that may (or may not) achieve what you require (see the inline comments):
library(dplyr)
#>
#> Attaching package: 'dplyr'
#> The following objects are masked from 'package:stats':
#>
#>     filter, lag
#> The following objects are masked from 'package:base':
#>
#>     intersect, setdiff, setequal, union
library(emmeans)

# Fit a very simple model since we don't have your data.
my_data <- lm(mpg ~ disp + cyl, data=mtcars)

my_data
#>
#> Call:
#> lm(formula = mpg ~ disp + cyl, data = mtcars)
#>
#> Coefficients:
#> (Intercept)         disp          cyl
#>    34.66099     -0.02058     -1.58728
summary(my_data)
#>
#> Call:
#> lm(formula = mpg ~ disp + cyl, data = mtcars)
#>
#> Residuals:
#>     Min      1Q  Median      3Q     Max
#> -4.4213 -2.1722 -0.6362  1.1899  7.0516
#>
#> Coefficients:
#>             Estimate Std. Error t value Pr(>|t|)
#> (Intercept) 34.66099    2.54700  13.609 4.02e-14 ***
#> disp        -0.02058    0.01026  -2.007   0.0542 .
#> cyl         -1.58728    0.71184  -2.230   0.0337 *
#> ---
#> Signif. codes:  0 '***' 0.001 '**' 0.01 '*' 0.05 '.' 0.1 ' ' 1
#>
#> Residual standard error: 3.055 on 29 degrees of freedom
#> Multiple R-squared:  0.7596, Adjusted R-squared:  0.743
#> F-statistic: 45.81 on 2 and 29 DF,  p-value: 1.058e-09

# This works with pairs() graphics function commented out, although
# in this example update() is achieving nothing.
em1 <- emmeans(my_data, "disp", by = "cyl") %>%
  as.data.frame() %>%
  #pairs() %>%
  update(by = NULL, adjust = "holm")

em1
#>  disp  cyl emmean   SE df lower.CL upper.CL
#>   231 6.19   20.1 0.54 29       19     21.2
#>
#> Confidence level used: 0.95

# This produces a non-sensical graph of the fitted model components
# and the output object is empty
em2 <- emmeans(my_data, "disp", by = "cyl") %>%
  as.data.frame() %>%
  update(by = NULL, adjust = "holm") %>%
  pairs()
em2
#> NULL
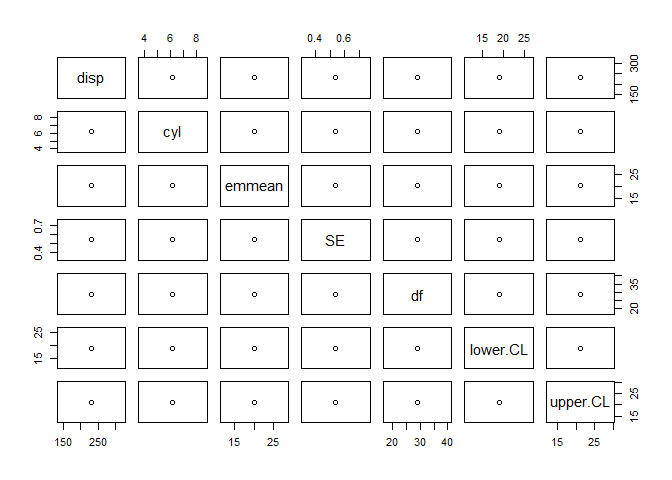
# Maybe what you really want is to look at your variables before any model fitting?
mtcars %>%
select(1:3) %>% # Include only the first three variables
pairs()
Hi @technocrat, thank you for your answer, I quite don't understand what you mean exactly, but as I answered in antoher comment - in the end I used a different approach. Thanks!