Hello,
When I run a ggplot I am getting an error message of "Error in identicalUnits(x) : object is not a unit”
I Updated RStudio as well as a few other packages (Tidyverse, Data Tables, more) today and I’m not sure if the error I’m getting is a result of the packages or R Studio.
Plotting worked earlier and previously. When I run the same code on my MacBook Pro (running RStudio 2022.12.0+353) it works without an error. Also if I run the same code in a Quarto document, it plots as expected without generating an error.
Simple sample plots and the errors from the console:
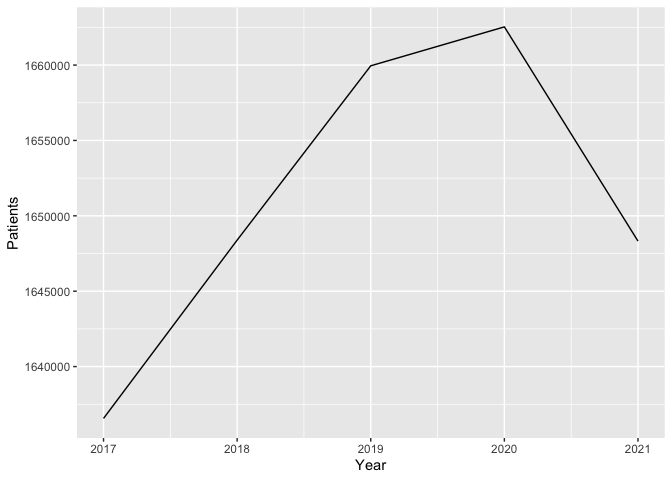
userpopyear1 %>%
ggplot(aes(x = Year, y = Patients)) +
geom_line()
> userpopyear1 %>%
+ ggplot(aes(x = Year, y = Patients)) +
+ geom_line()
Error in identicalUnits(x) : object is not a unit
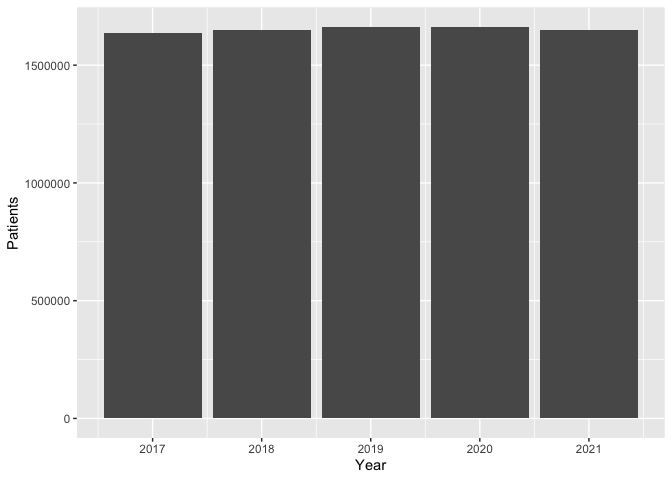
userpopyear1 %>%
ggplot(aes(x = Year, y = Patients)) +
geom_bar(stat = "identity”)
> userpopyear1 %>%
+ ggplot(aes(x = Year, y = Patients)) +
+ geom_bar(stat = "identity")
Error in identicalUnits(x) : object is not a unit
I have also tried changing the year to a factor but receive the same error message.
My setup:
MacMini with M1 chip
OSX 13.2.1 (Ventura)
R 4.2.3 GUI 1.79 ARM build
RStudio 2023.02.0+386
Again, this may not be related to RStudio, but I can't figure out why I'm getting this error or what I can do to prevent it.
Any information is appreciated!
Thank you for the response; however, I am not having a problem with making the code to create the plots, the problem I am having is that as of Wednesday evening, after updating, I am suddenly getting the error "Error in identicalUnits(x) : object is not a unit" when I try to run them. I do not know what this error means or why I'm seeing it.
The error message is consistent - it will always appear, but sometimes I can restart RStudio, work through my script and get the first one or two plots to display once, however, if I try to do it again or if I try to plot more, I will get the error.
I am unable to bypass the error and I can't think of anything to do to prevent the error from occurring. A web search of the error does not show any information - so I'm stuck until I can figure out what may be going on.
I think my lesson learned is to only update the app or one package at a time.
I think I found my solution ...
After going back and turning off various packages one at a time, it appears that the reactablefmtr package is causing the error to occur. When I do not load the reactablefmtr library at the start of an R session, I am not getting the error message.
R is back to working and life is good!