Hi all ! I am trying to create a geom extension. I have the following issue :
I expected setup_data to add the required_aes in the data and then pass it to draw_group
but the setup_data method fails as it enters draw_group method and throws the above mentioned error.
Please offer some suggestions !
the data after setup_params looks like this
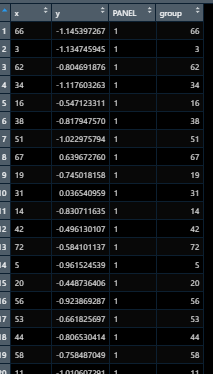
The data just before setup_data finishes
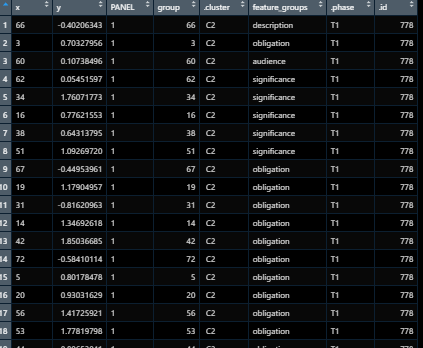
What the data should like : 
GeomRbar <- ggplot2::ggproto("GeomRbar", ggplot2::Geom,
  required_aes = c("x", "y"),
  default_aes = ggplot2::aes(
    fill = "grey60",
    size = 1.25,
    colour_inner_circle = "grey90",
    standard_error = TRUE
  ),

  setup_data = function(data, params) {
    browser()

    data <- data %>%
      dplyr::mutate(.cluster = params$cluster_assignment) %>%
      dplyr::mutate(feature_groups = params$group_names)

    if (!is.null(params$cluster_phase)) {
      data <- data %>% dplyr::mutate(.phase = params$cluster_phase)
    } else {
      data <- data %>% dplyr::mutate(.phase := NA_character_)
    }

    if (!is.null(params$unique_id)) {
      data <- data %>% dplyr::mutate(.id = params$unique_id)
    } else {
      data <- data %>% mutate(.id := NA_character_)
    }

    vars_dummy <- setdiff(c(".phase", ".id", ".cluster", "feature_groups"), names(data))

    if (length(vars_dummy) > 0) {
      rlang::abort("Data doesn't have required structure to build the plot")
    }

    ####  Calculate cluster average for each feature
    if (!is.null(params$cluster_idx)) {
      rlang::inform("Calculating cluster average for each feature")

      data <- data %>% dplyr::filter(.cluster == levels(.cluster)[params$cluster_idx]) # now contains observations from one cluster(cluster of interest) e.g C2 has 23713 observations
    }


    if (!is.null(params$cluster_idx)) {
      data <- data %>%
        dplyr::mutate(.cluster = forcats::fct_drop(as.factor(.cluster))) %>% # fct_drop - drops unused levels
        dplyr::mutate(.cluster = factor(.cluster, labels = paste(params$cluster_abbrev, levels(.cluster)))) # add cluster_abbrev to .cluster e.g : PT C2
    } else {
      data <- data
    }

    browser()
  },
  # draw_group ----------------------------------------------------------------------------------------------------------------------------------------------------------------------------------------------------------
  draw_group = function(data, params, cluster_idx = NULL,
                        cluster_assignment = NULL,
                        phase_present = FALSE,
                        cluster_phase = NULL,
                        cluster_name = NULL,
                        cluster_abbrev = NULL,
                        colour_clusters = NULL,
                        scale_rng = c(-1, 1) * 1.5,
                        data_dict = NULL,
                        delta_threshold = 0.25,
                        group_names = NULL,
                        show_group_names = FALSE,
                        unique_id = NULL,
                        na.rm = FALSE) {
    data_check <- data

    browser()