My name is Jordan, and I am relatively new to Shiny and need some assistance on an error I keep encountering on my app. I have the user interface portion of it all set, but I've been struggling with the server portion for a few months, and I'm unsure where to turn to next after going through a plethora of resources.
Just some background on where the code. The work I do deals with sepsis and proteomics. Specifically, I look into the different signaling pathways that could play a role in sepsis progression and use modeling algorithms to try to identify therapeutic targets (proteins) in these pathways. A database called KEGG stores a plethora of signaling pathways. I’m using an algorithm called flux balance analysis which measures the efficiency and robustness of signal transmittance between different protein-protein interactions on a signaling pathway. So, the 1000 line R code that I have plots a biological signaling pathway with flux balance analysis values on it which highlights the interactions that are critical in maintaining network functionality/stability, after you tune the parameters which I was able to do. The code works perfectly outside of Shiny in a normal R script, but once I run the app and upload/input the parameters to produce the figure, it does not go through.
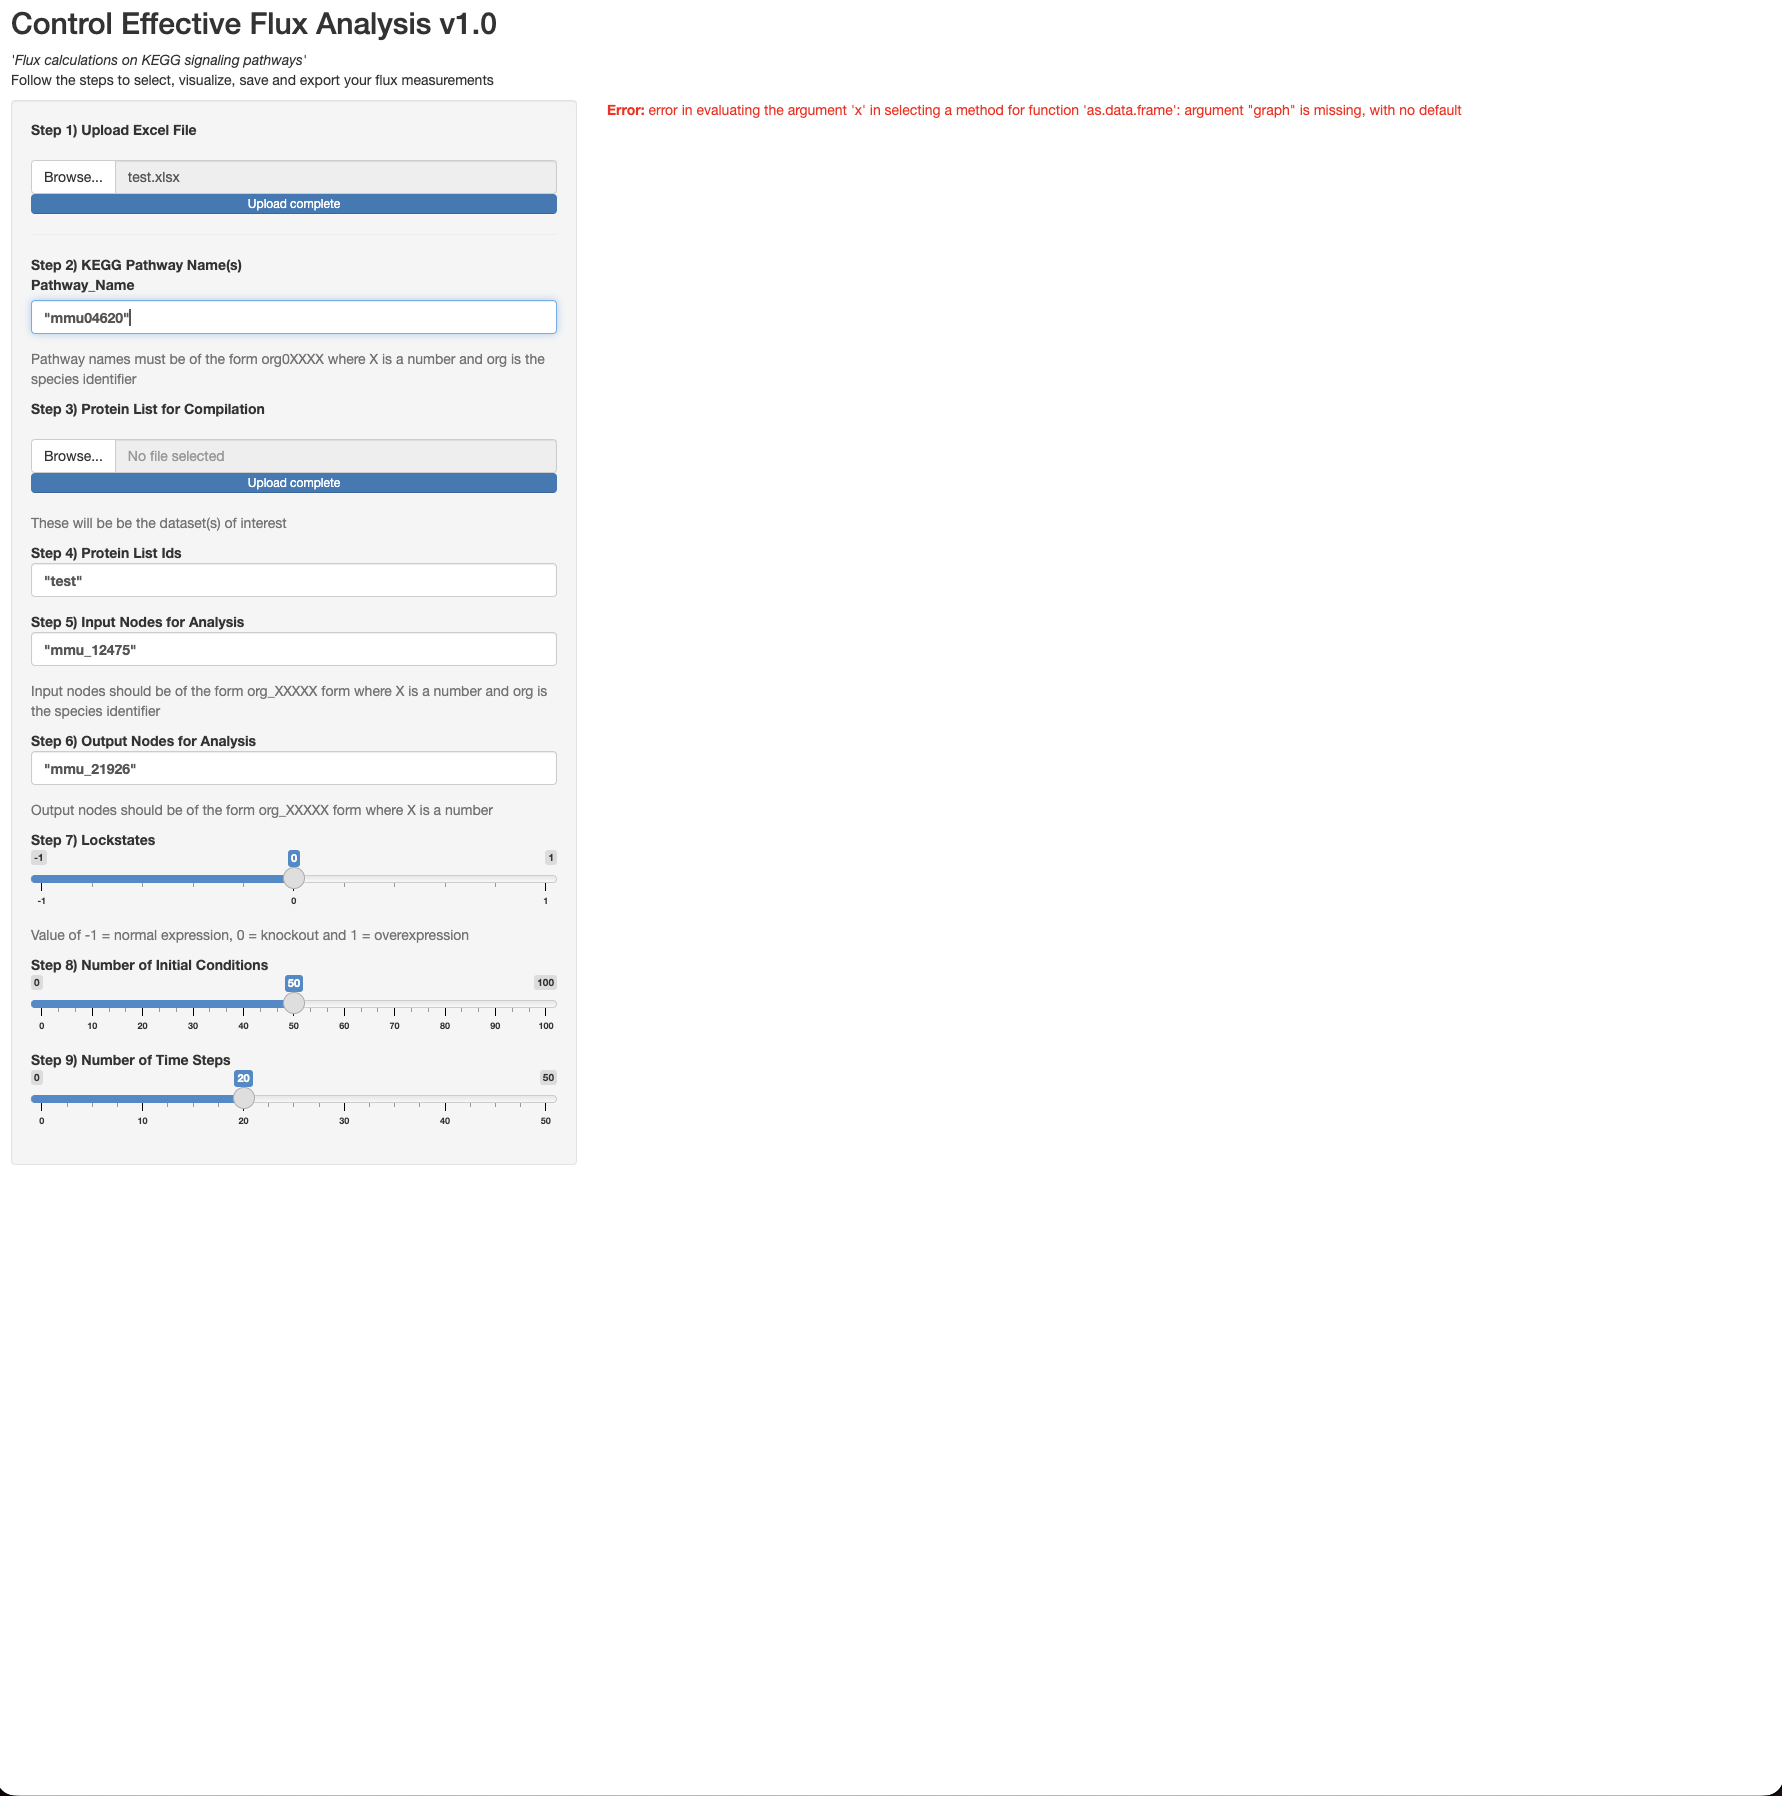
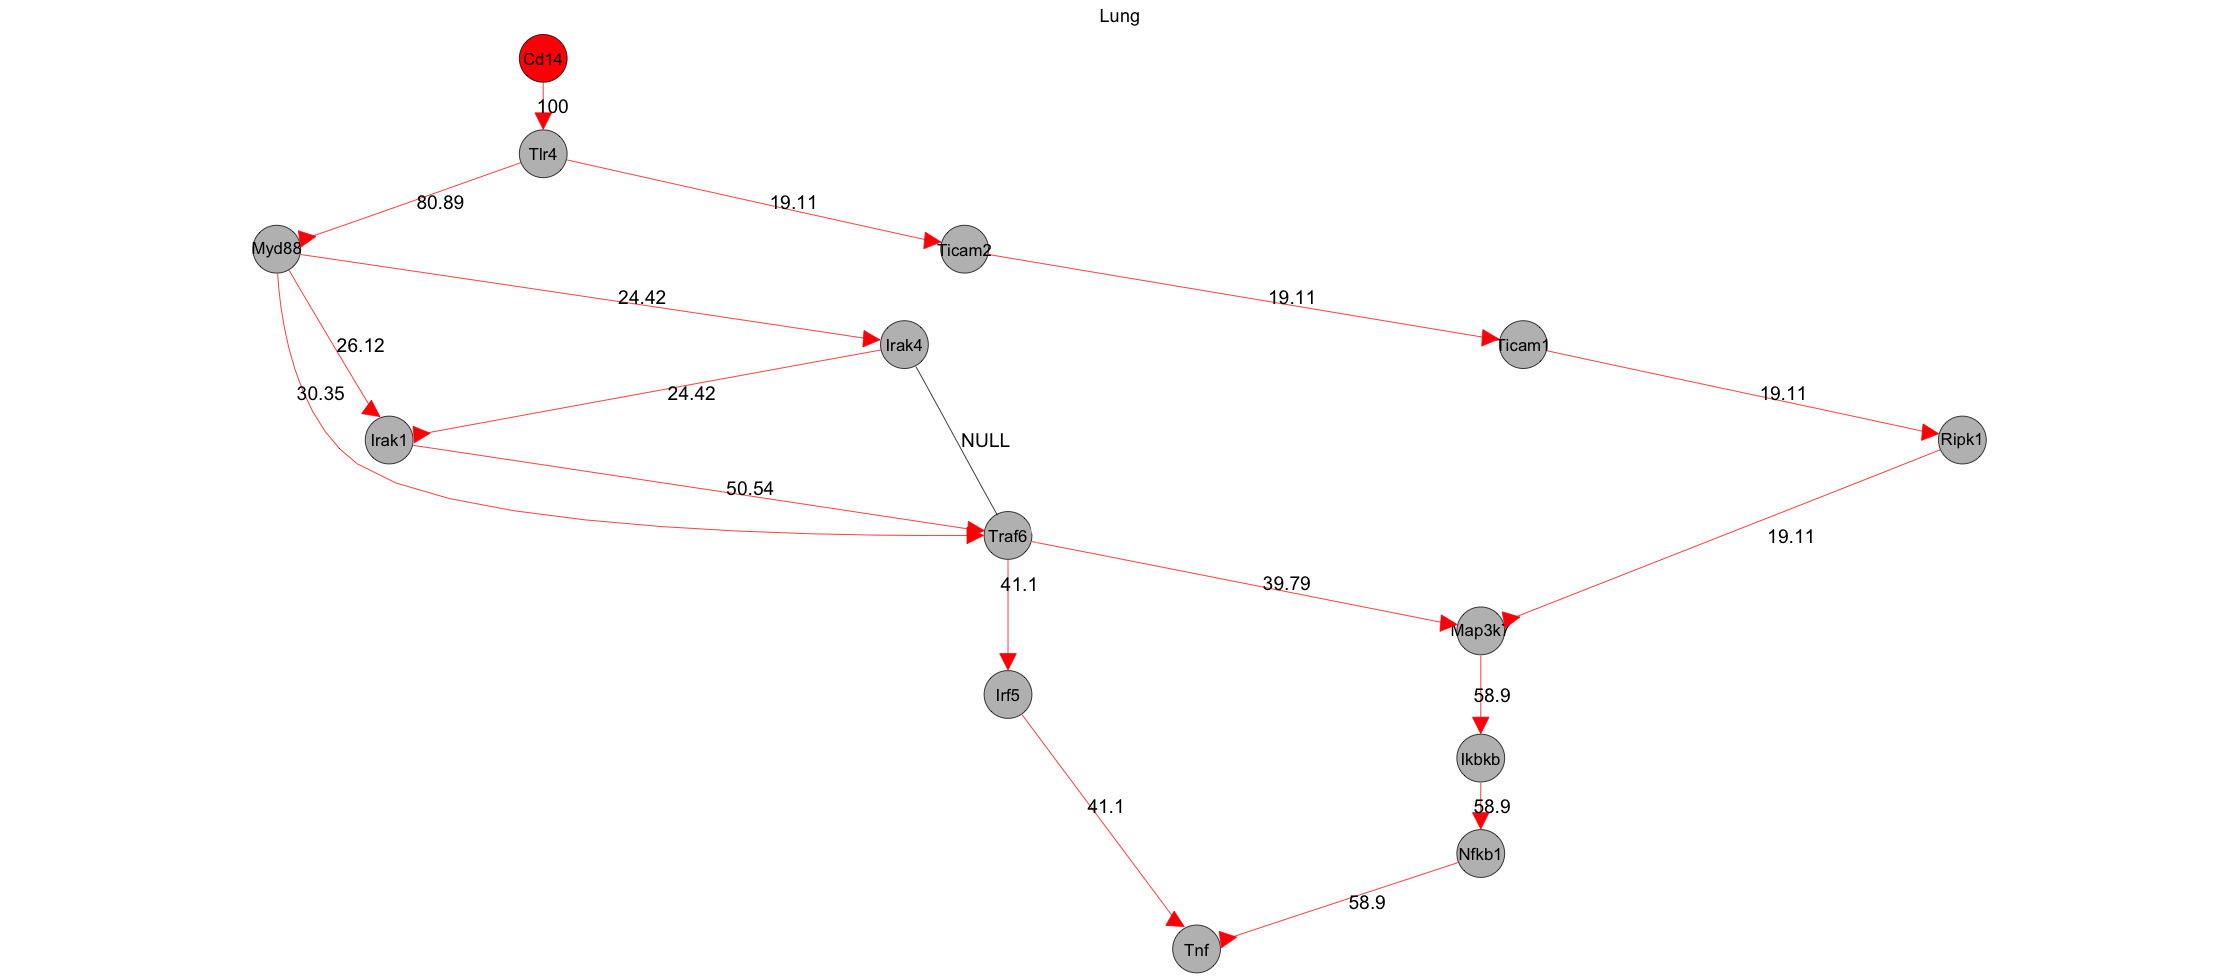
I've attached a few things. One is the code (in a normal R script termed "CEF.R"), another is the code using Shiny formatting (termed "Shiny CEF analysis.R"), third thing is an example excel file (termed "test.xlsx") to read in for reproducing the figure (termed "CEF Example plot"). I've also attached the Shiny GUI app and the error I receive even after inputting everything in the left side panel. When you run CEF.R script from beginning to end, you should get the CEF Example plot as a png. When you run the Shiny CEF analysis script, the app does
come up, but there is an error, even after uploading the parameters into the left side panel.
It seems like I'm unable to upload my R scripts on this platform as well. Since they're very long, it would probably be easier to just upload them for anybody to download and investigate, please advise.
I know this is a lot and could seem very confusing, but if there are any questions please let me know!
A few thoughts on this:
When it works with the original script but not the shiny application then maybe the reactivities or the inputs aren't defined correctly.
For example I don't think the inputs (e.g. Step2) should be given in quotation marks, as this is anyway a text-input that gives an text. (Moreover, to make it more error-proof you should probably prepare a dropdown-list for this)
To troubleshoot your shiny app you can add some print-statements to see if you actually generate the results you expect. E.g. after each input you can use something like a print(head(table_you_just_created)) to see the intermediate results. Or even use the renderTable function to show the intermediate results (and remove this once everything works fine)
Thanks for the advice Matthias. So for steps 2,4, 5 and 6, I think the inputs have to be a string in order for the code to run successfully (whether in a shiny script or not). I just tried running it as a non-string, and the error I received was object not found. Specifically, the input for step 2 is the name of a pathway for a particular species from a pathway database, which then is submitted to a function where it reads the pathway identification, gets the URL of the file from the pathway database and prepares it for mapping in R. In step 4, that is the name of the "graph" graphNEL object that is generated from the two functions that prepares the pathway (from step 2) and maps omics data onto it. So when you view the graphNEL object resulting from step 2, it shows the pathway as well as what differentially expressed proteins (color-coded) mapped to it. Steps 5 and 6 are the specific names/identifications of input and output proteins (e.g., from mouse) for CEF analysis, which is shown in the figure on the bottom in my initial post.
So, are you saying I should not use a textinput function to upload the strings parameters for steps 2,4,5 and 6, or are you recommending something else? Without quotes, the code doesn't successfully run through (outside of a Shiny environment that is), so I don't think it would work using Shiny formatting.
yes, and they are naturally strings by virtue of being characters within a text input. but you are extending the string i.e. by adding your own additional quotation marks; these additional marks that you interactively typed into the box do not alter the characteristics of the contents between them; they dont function to turn them into a string; they merely lengthen the string, with their content. i.e. only do this; if there are contents of your strings which have quote marks.
Here is an example
what_jon_said <- 'John Said "Hello Everyone"'
cat(what_jon_said)
you are doing the equivalent of adding additional marks into a string as above.
Here is more example content for your to contemplate; think about what is the same and what is different in these examples
Thanks for the input nirgrahamuk. I understand how manually putting quotes around a text that will be called using textInput is redundant and prone to error. Even when I did that (removed the quotes), the error message didn't disappear nor did the reactivity budget which makes me think that there is something wrong with where I place reactive({}) functions in the code. I've played around with the reactivity function for a long time (putting it at multiple locations sometimes more than one) before posting the issue I've been having on this forum, but no matter what new or old error arises, I'm still unable to generate the example plot I've attached in a Shiny app.
I did try using reprex to create a reproducible example of the code and did strip away any unnecessary parts (except for critical comments), but the character count is still way over, and so it will not allow me to post it. In order to generate the figure that I want to produce in a Shiny app, there are many, complex functions embedded prior to uploading the inputs that will eventually be called at the end of the script. Any other ways I can send/post my script, besides emailing it if that is possible?
As I said, you see the result isn't working and you don't know what happens in between. If I'd guess I say the processing just gives an empty table, due to some differences in the imported data structures so the plot cannot be generated.
I would advise you to break it down into its elements, either by creating a new app from the existing one testing every single step or by adding checks all over the script, by adding new outputs you just don't use yet, export intermediate results as csv or by simple adding a lot of print() statements, showing the state of the processing into the console. For functions even something like print("Start function XXX") and print("Function XX done!") would even help if you are unsure about the reactivity - to make sure everything is run in the correct order.
Step 1 - Upload the file: Is it there? - tableOutput.
Step 2 - Select the pathway: Was it successfully downloaded? Show the content.
Step 3, 4, 5... Interaction results: Is the original table modified in a way it should be? Is it shorter (filtered) - print(dim(table_before)) & print(dim(table_after)) , does it contain new columns - tableOutput / print(colnames(table), does it only contain the proteins selected (print(unique(table$protein.name))
And finally: Do the data that goes into the graph actually contain data?
PS: You can eventually drop the code (together with the input files) at github, but not sure if we want to check through the 1000 lines.
PPS: Step3: Why was no file selected but the upload is complete?