Tired22
February 26, 2023, 5:25pm
1
Hi!
ggplot(CrownVolume1, aes(x=Art., y=Crown_volume_May, fill=Art., ylim = c(0, 30)))+
Error in check_aesthetics():rlang::last_error() to see where the error occurred.
Backtrace:
base (local) <fn>(x)
ggplot2:::print.ggplot(x)
ggplot2:::ggplot_build.ggplot(x)
ggplot2 (local) by_layer(function(l, d) l$compute_aesthetics(d, plot))
ggplot2 (local) f(l = layers[[i]], d = data[[i]])
l$compute_aesthetics(d, plot)
ggplot2 (local) f(..., self = self)
ggplot2:::check_aesthetics(evaled, n)rlang::last_trace() to see the full context.
rlang::last_trace()check_aesthetics():
Backtrace:
├─base (local) <fn>(x)
└─ggplot2:::print.ggplot(x)
├─ggplot2::ggplot_build(x)
└─ggplot2:::ggplot_build.ggplot(x)
└─ggplot2 (local) by_layer(function(l, d) l$compute_aesthetics(d, plot))
└─ggplot2 (local) f(l = layers[[i]], d = data[[i]])
└─l$compute_aesthetics(d, plot)
└─ggplot2 (local) f(..., self = self)
└─ggplot2:::check_aesthetics(evaled, n)
└─rlang::abort(...)
ylim should never be inside aes()+ plussed on, or you are plussing on a scale_x_* function and setting a limit on that.
First check the correct name of columns.
Maybe is Artgeom_col() inside geom_bar() ?
Like said @nirgrahamuk , in the aes() not put ylim attributes .
Tired22
February 26, 2023, 6:55pm
4
I have taken it out of aes() and now I get a different error:
ggplot(CrownVolume1, aes(x=Art., y=Crown_volume_May, fill=Art.))+
Tired22
February 26, 2023, 6:57pm
5
Nothing changes if I do
ggplot(CrownVolume1, aes(x=Art., y=Crown_volume_May, fill=Art.))+
I still get the error
Error in c(0, 30) + labs(title = "May CVP", x = "Species", y = "CVP (m³)") :
I have checked column names and they are ok, it is indeed "Art."
Try to put a reproducible example of data, like this:
A minimal reproducible example consists of the following items:
A minimal dataset, necessary to reproduce the issue
The minimal runnable code necessary to reproduce the issue, which can be run
on the given dataset, and including the necessary information on the used packages.
Let's quickly go over each one of these with examples:
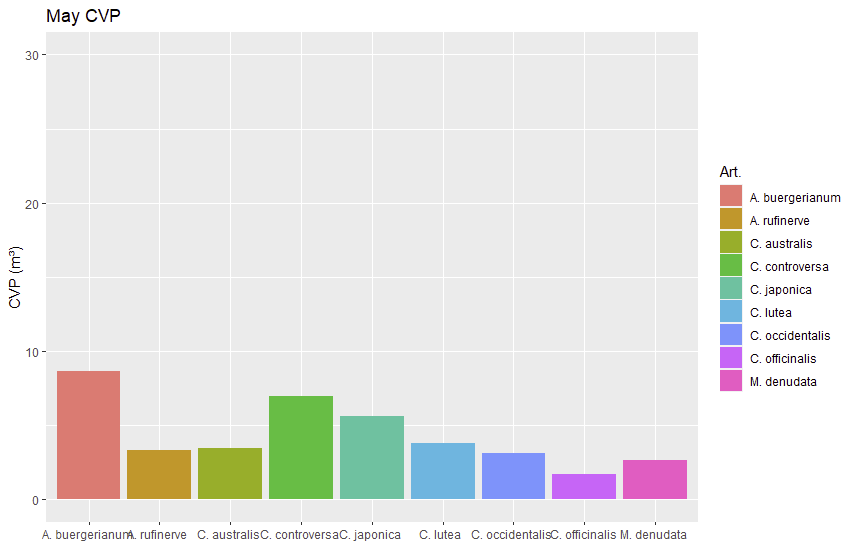
# with a toy data, this script run well.

CrownVolume <- data.frame(
  Art = c("Species 1", "Species 2", "Species 3", "Species 4", "Species 5"),
  Crown_volume_May = c(15.2, 20.3, 10.5, 7.8, 25.1))

ggplot(CrownVolume, aes(x = Art, y = Crown_volume_May, fill = Art)) +
  geom_bar(stat = "identity") +
  ylim(0, 30) +
  labs(title = "May CVP",
       x = "Species",
       y = "CVP (m³)")
2 Likes
I think @M_AcostaCH 's example solves it. Change ylim = c(0, 30) to ylim(0, 30).
Tired22
February 27, 2023, 9:35am
8
It has indeed fixed it. Thank you for pointing it out, I didn't see it at first glance.
You should be able to add on the following to the end of your plot code:
theme(axis.text.x = element_blank()
Tired22
February 27, 2023, 4:34pm
10
Works perfectly. Thank you very much.
system
March 6, 2023, 4:34pm
11
This topic was automatically closed 7 days after the last reply. New replies are no longer allowed.