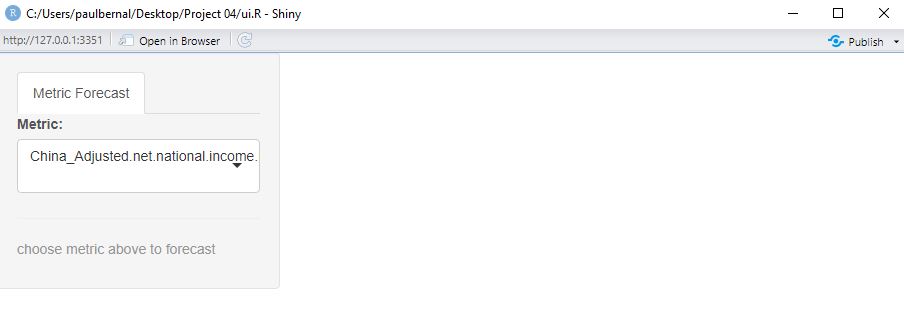
This is the first time I write on here, so please excuse me if I do not use the proper format. I was trying to create an interactive forecasting application using Shiny.
Whenever I try to run the app, I get the following error: the condition has length > 1.
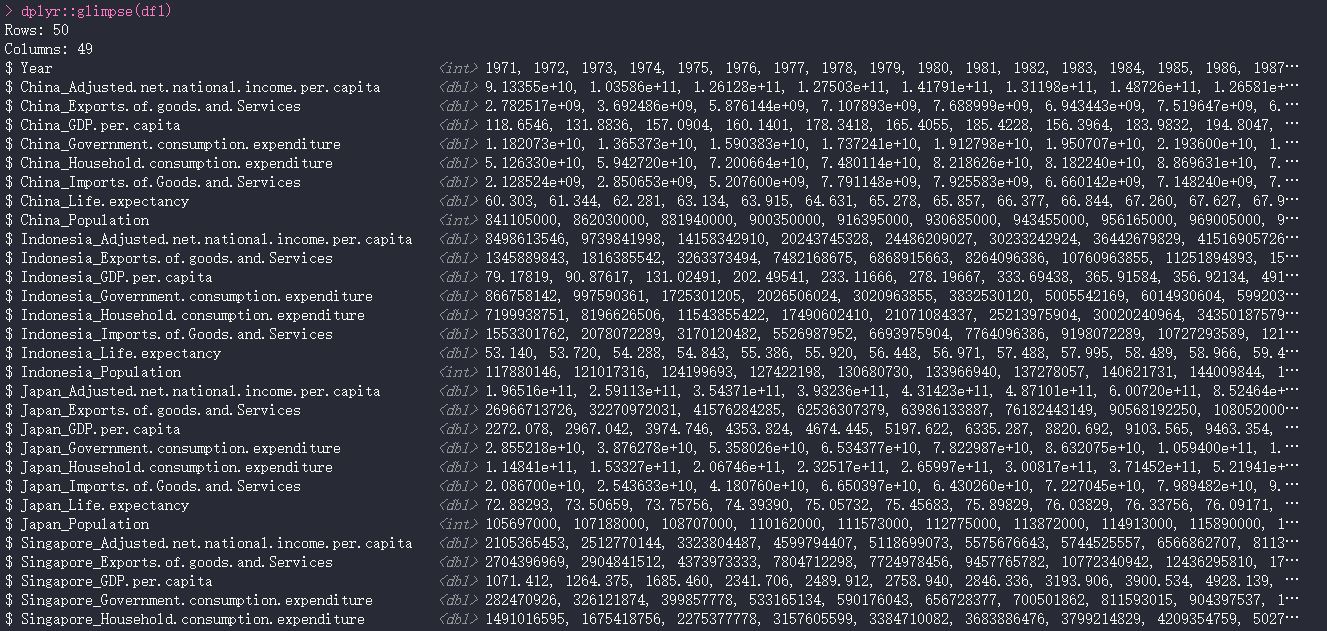
I tried to include the dataset I am using for this app but it seems that I am not allowed to attach it.
What could be causing this error?
Here is my ui.R code:
#install.packages("plyr")
#install.packages("rintrojs")
#install.packages("DT")
#install.packages("forecast")
#loading required packages
library(readxl)
library(plotly)
library(shinycssloaders)
library(shinythemes)
library(shinydashboard)
library(plyr)
library(rintrojs)
library(DT)
library(forecast)
#defining working directory
setwd("C:/Users/paulbernal/Desktop/Project 04")
#importing dataset for interactive visualization
df1 <- read.csv("dataset01.csv")
shinyUI(fluidPage(theme = shinytheme("cerulean"),
tabPanel("Forecasting",
fluidRow(
sidebarLayout(
sidebarPanel(
tabsetPanel(id = "tabs",
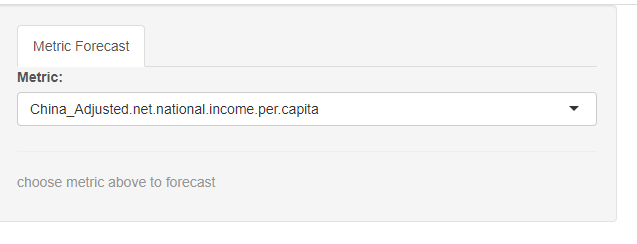
tabPanel("Metric Forecast", value = "Tab1",
selectInput("Metric", "Metric:",
choices = colnames(df1[2:49]),
hr(),
helpText("choose metric above to forecast")))),
mainPanel(
plotlyOutput("Plot1")
)
))))))
This is my server.R code:
#installing required R packages for shiny app
#install.packages("readxl")
#install.packages("plotly")
#install.packages("shiny")
#install.packages("shinycssloaders")
#install.packages("shinythemes")
#install.packages("shinydashboard")
#install.packages("plyr")
#install.packages("rintrojs")
#install.packages("DT")
#install.packages("forecast")
#loading required packages
library(readxl)
library(plotly)
library(shinycssloaders)
library(shinythemes)
library(shinydashboard)
library(plyr)
library(rintrojs)
library(DT)
library(forecast)
#defining working directory
setwd("C:/Users/paulbernal/Desktop/Project 04")
#importing dataset for interactive visualization
df1 <- read.csv("dataset01.csv")
#create forecast dates
fcast_dates <- (2021:2027)
server <- function(input, output) {
  observeEvent(input$Metric, {

      output$plot1 <- renderPlotly({
        plot_ly(x = df1$Year, y = df1[,colnames(df1) == input$Metric], name = 'Historical',
                type = 'scatter', mode = 'lines', line = list(color = 'rgb(205, 12, 24', width = 4))%>%
          add_trace(x = fcast_dates, y = forecast(auto.arima(df1[,colnames(df1) == input$Metric]), h = 7)$mean,
                    name = 'Forecast', line = list(color = 'rgb(22, 96, 167)', diwth = 4, dash = 'dot'))%>%
          layout(title = "Non-Seasonal Forecast)",
                 xaxis = list(title = "Years"),
                 yaxis = list(title = "Selected Metric"))

      })})}