exponential decay trend line and equation in the plot

Hi,

I have a data Dropbox - sample_data_trasport.csv - Simplify your life

I used the code

  shapes <- c(5, 16, 18, 3, 15, 4, 6, 8, 17, 13, 2)

  trasport_time %>% 
    filter(PM2.5 > 25) %>% 
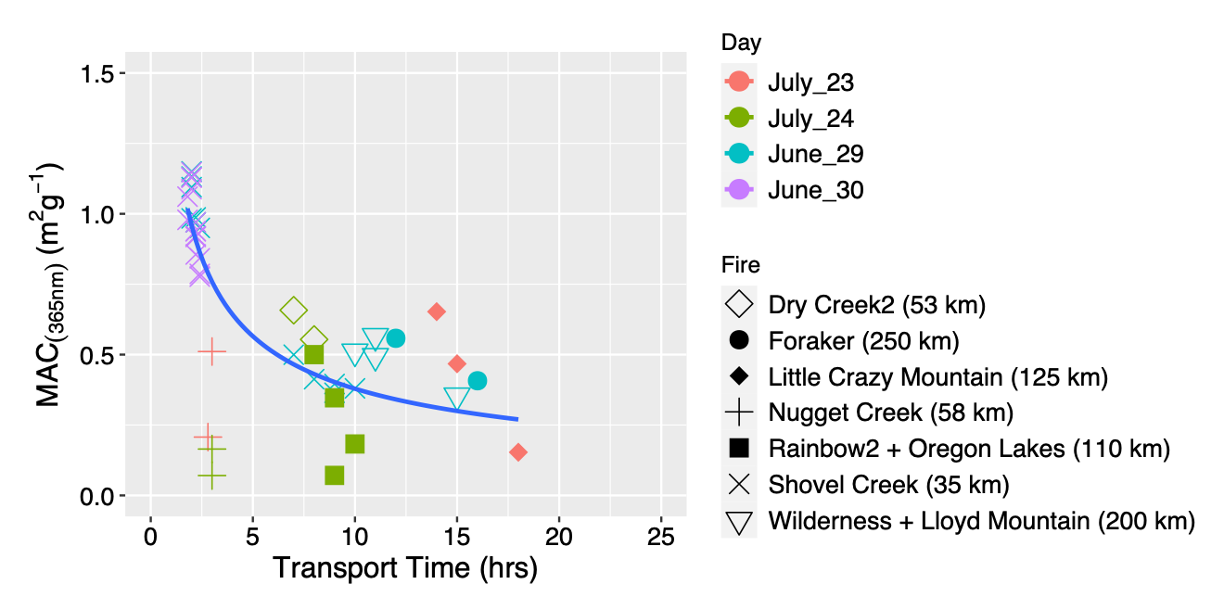
    ggplot(aes(x = Transport_time_hrs, y = mac_365, shape=(Fire_Name),
               color=(day))) +
    geom_point( alpha=1, size = 4)+  scale_shape_manual(values = shapes)+
    xlim(0,25)+ 
    ylim(0,1.5) + geom_smooth(aes(group = 1),method=lm,  se=F)+
    #scale_y_continuous(breaks=c(0,0.16,0.31,0.5,0.63,1.03,1.28))+
    #scale_color_gradientn(colours = rainbow(5), limits=c(1,30), breaks = c(2,10,20,30), name= expression(Photobleaching~time(hrs)))+ 
    #scale_color_brewer(palette="Dark2")+ 
    #geom_smooth(aes(color = Photpbleaching_lifetime_hrs), size = 0.5, se = T, )+ 
    theme(legend.text=element_text(size=12)) + 
    theme(axis.title = element_text(face="plain",size=14,color="black"),
          axis.text=element_text(size=12,face="plain", color="black"),
          plot.title = element_text(size=15)) +
    #theme(panel.grid.major.y = element_line(color = "black",
    #                                        size = 0.05,
    #                                        linetype = 1))+
    #theme(panel.background = element_rect(colour = "black", size=1)) + 
    #theme(panel.background = element_rect(fill = "white")) + 
    ylab(bquote("MAC"[(365*nm)]~ '('*m^2*g^-1*')')) +
    xlab(bquote('Transport Time ('*hrs*')')) +  
    labs(title = "")+ labs(shape="Fire", color="Day")
  

from this I made

The query is that I want to change the linear trend line to the power fit trend line and its equation.

Could anyone please help me on this matter?

Thanks

I am able to get the exponential decay fitting line by adding

geom_smooth(aes(group = 1), method = "nls", formula = y ~ a * x^b, 
                se = FALSE, method.args = list(start = c(a = 1, b = 1)))

Not the plot looks like

But, now I am not able to add the exponential decay fitting equation in the plot:
some example is given
https://douglas-watson.github.io/post/2018-09_exponential_curve_fitting/

But not able to do that.

Please help me how to get this equation in the plot.
y(t)∼yf+(y0−yf)e−αt

Thanks

If you just want to add it as text, you can use geom_label(), geom_text(), or:

annotate("text", x = 10, y = 1, label = "y(t) = yf+(y0−yf)e−αt")

where you change x and y to sensible values.

If you want to display it as a proper mathematical equation, you need to use the plotmath notation, and in particular change ~ to %~%, change the to a normal -, possibly add a ^ etc...

eq <- expression(y(t) %~% yf + (y0 - yf) * e^(-αt))

ggplot(...)  +
  annotate("text", x = 10, y = 1, label = eq)

This topic was automatically closed 42 days after the last reply. New replies are no longer allowed.

If you have a query related to it or one of the replies, start a new topic and refer back with a link.