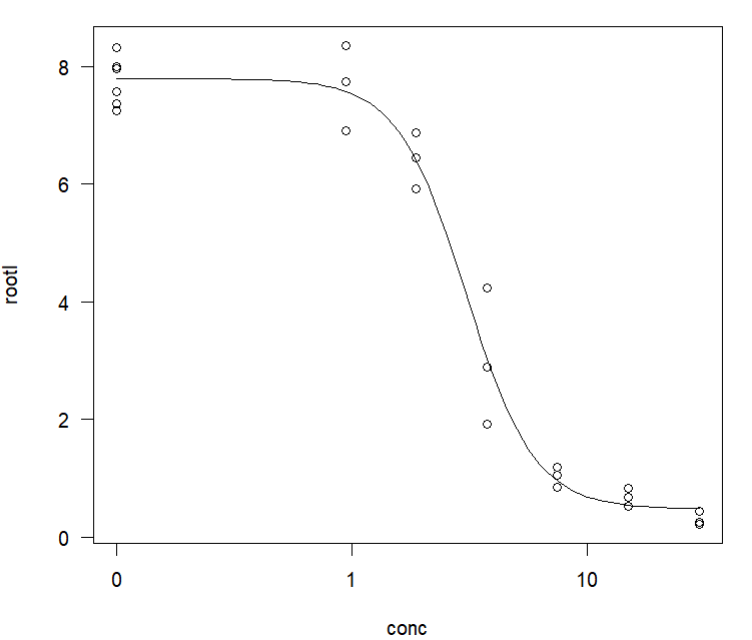
Per this tutorial using the drc package, plot a dose-response curve:
library(tidyverse)
library(drc)

toxdata<- ryegrass

model<- drm(rootl~conc, data=ryegrass, fct=LL.4(names = c("Slope", "Lower Limit", "Upper Limit", "ED50")))

plot(model, type="all")
How can I extract the predicted (interpolated?) points in between the observed points?
For example, if I want to find out which point within the curve lies closest to y=4.5 ?
FJCC
February 6, 2023, 9:09pm
2
Here is code to get y values from a given x and x from a given y, using the ryegrass data set.
library(drc)
#> Loading required package: MASS
#>
#> 'drc' has been loaded.
#> Please cite R and 'drc' if used for a publication,
#> for references type 'citation()' and 'citation('drc')'.
#>
#> Attaching package: 'drc'
#> The following objects are masked from 'package:stats':
#>
#> gaussian, getInitial
toxdata<- data("ryegrass")
model<- drm(rootl~conc, data=ryegrass, fct=LL.4(names = c("Slope", "Lower Limit", "Upper Limit", "ED50")))
summary(model)
#>
#> Model fitted: Log-logistic (ED50 as parameter) (4 parms)
#>
#> Parameter estimates:
#>
#> Estimate Std. Error t-value p-value
#> Slope:(Intercept) 2.98222 0.46506 6.4125 2.960e-06 ***
#> Lower Limit:(Intercept) 0.48141 0.21219 2.2688 0.03451 *
#> Upper Limit:(Intercept) 7.79296 0.18857 41.3272 < 2.2e-16 ***
#> ED50:(Intercept) 3.05795 0.18573 16.4644 4.268e-13 ***
#> ---
#> Signif. codes: 0 '***' 0.001 '**' 0.01 '*' 0.05 '.' 0.1 ' ' 1
#>
#> Residual standard error:
#>
#> 0.5196256 (20 degrees of freedom)
S <- model$fit$par[1]
LL <- model$fit$par[2]
UL <- model$fit$par[3]
ED50 <- model$fit$par[4]
#Calc rootl from a given conc
X <- 0.94
Rootl <- LL + (UL - LL)/(1 + (ED50/X)^-S)
Rootl
#> [1] 7.582331
#Calc conc from a given rootl
Y <- 4.5
Conc <- ED50/((UL-Y)/(Y-LL))^(-1/S)
Conc
#> [1] 2.860422
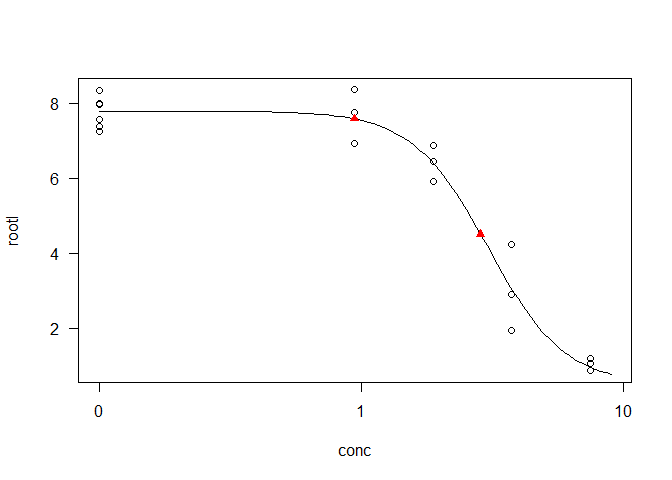
plot(model, type="all", xlim = c(0,9))
points(c(X, Conc), c(Rootl, Y), pch = 17, col = "red")
Created on 2023-02-06 with reprex v2.0.2
1 Like
FJCC
February 6, 2023, 9:11pm
3
I should have mentioned that you can go from a concentration to a rootl with the predict function.
predict(model, data.frame(conc = 0.94))
Prediction
  7.582331
1 Like
@FJCC beat me to it. I had gotten as far as seeing the shape
library(drc)
#> Loading required package: MASS
#>
#> 'drc' has been loaded.
#> Please cite R and 'drc' if used for a publication,
#> for references type 'citation()' and 'citation('drc')'.
#>
#> Attaching package: 'drc'
#> The following objects are masked from 'package:stats':
#>
#> gaussian, getInitial
toxdata <- ryegrass
model <- drm(rootl~conc, data=ryegrass, fct=LL.4(names = c("Slope", "Lower Limit", "Upper Limit", "ED50")))
dev.off()
#> null device
#> 1
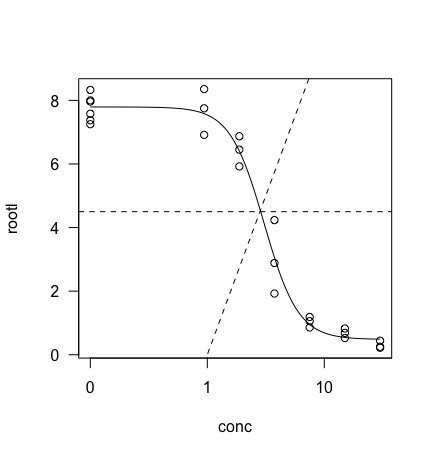
plot(model, type="all")
abline(4.5,0,lty = 2)
abline(0,10,lty = 2)
system
February 27, 2023, 9:14pm
5
This topic was automatically closed 21 days after the last reply. New replies are no longer allowed.