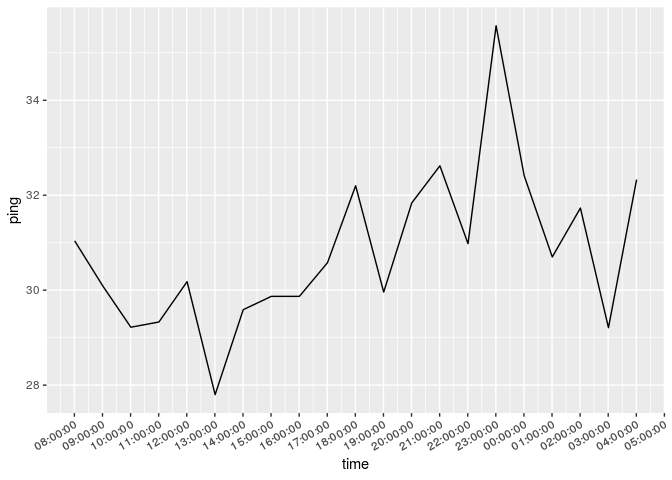
I you just want to use time on a continuous scale there is no need to modify your timestamp, you can use scale_x_datetime()
library(ggplot2)
library(dplyr)
data <- data.frame(
    time = as.POSIXct(c("2018-11-06 08:00:33", "2018-11-06 09:00:35",
                        "2018-11-06 10:00:35", "2018-11-06 11:00:33",
                        "2018-11-06 12:00:41", "2018-11-06 13:00:34", "2018-11-06 14:00:38",
                        "2018-11-06 15:00:37", "2018-11-06 16:00:34", "2018-11-06 17:00:34",
                        "2018-11-06 18:00:37", "2018-11-06 19:00:33", "2018-11-06 20:00:36",
                        "2018-11-06 21:00:35", "2018-11-06 22:00:37",
                        "2018-11-06 23:00:36", "2018-11-07 00:00:35", "2018-11-07 01:00:34",
                        "2018-11-07 02:00:36", "2018-11-07 03:00:33", "2018-11-07 04:00:37")),
    ping = c(31.04, 30.09, 29.22, 29.33, 30.18, 27.8, 29.59, 29.87, 29.87,
             30.58, 32.2, 29.96, 31.84, 32.62, 30.98, 35.57, 32.41, 30.7,
             31.73, 29.21, 32.33)
)

data %>%
    ggplot(aes(x = time, y = ping)) +
    geom_line() +
    scale_x_datetime(date_breaks = "1 hour", date_labels = '%H:%M:%S') +
    theme(axis.text.x = element_text(angle=30, hjust=1, vjust = 1))
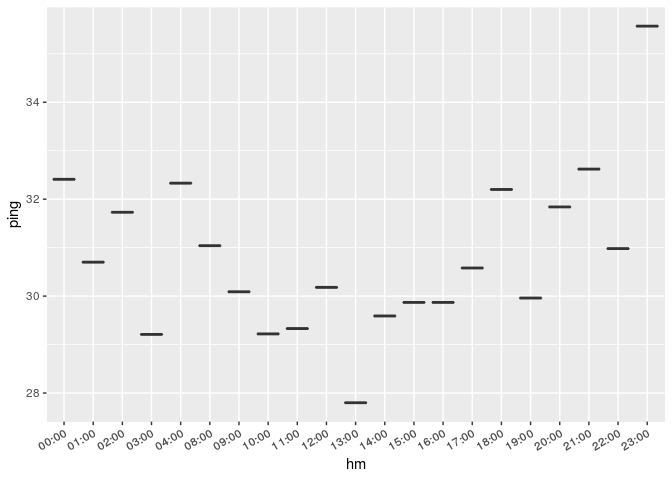
If you want to use time on a discrete scale you can do something like this
library(ggplot2)
library(dplyr)
library(tibbletime)

data <- data.frame(
    time = as.POSIXct(c("2018-11-06 08:00:33", "2018-11-06 09:00:35",
                        "2018-11-06 10:00:35", "2018-11-06 11:00:33",
                        "2018-11-06 12:00:41", "2018-11-06 13:00:34", "2018-11-06 14:00:38",
                        "2018-11-06 15:00:37", "2018-11-06 16:00:34", "2018-11-06 17:00:34",
                        "2018-11-06 18:00:37", "2018-11-06 19:00:33", "2018-11-06 20:00:36",
                        "2018-11-06 21:00:35", "2018-11-06 22:00:37",
                        "2018-11-06 23:00:36", "2018-11-07 00:00:35", "2018-11-07 01:00:34",
                        "2018-11-07 02:00:36", "2018-11-07 03:00:33", "2018-11-07 04:00:37")),
    ping = c(31.04, 30.09, 29.22, 29.33, 30.18, 27.8, 29.59, 29.87, 29.87,
             30.58, 32.2, 29.96, 31.84, 32.62, 30.98, 35.57, 32.41, 30.7,
             31.73, 29.21, 32.33)
)

data %>%
    as_tbl_time(index = time) %>%
    collapse_by('1 hour', side = 'start', clean = TRUE) %>%
    mutate(hm = format(time, "%H:%M")) %>%
    ggplot(aes(x = hm, y = ping)) +
    geom_boxplot() +
    theme(axis.text.x = element_text(angle=30, hjust=1, vjust = 1))