Hi,
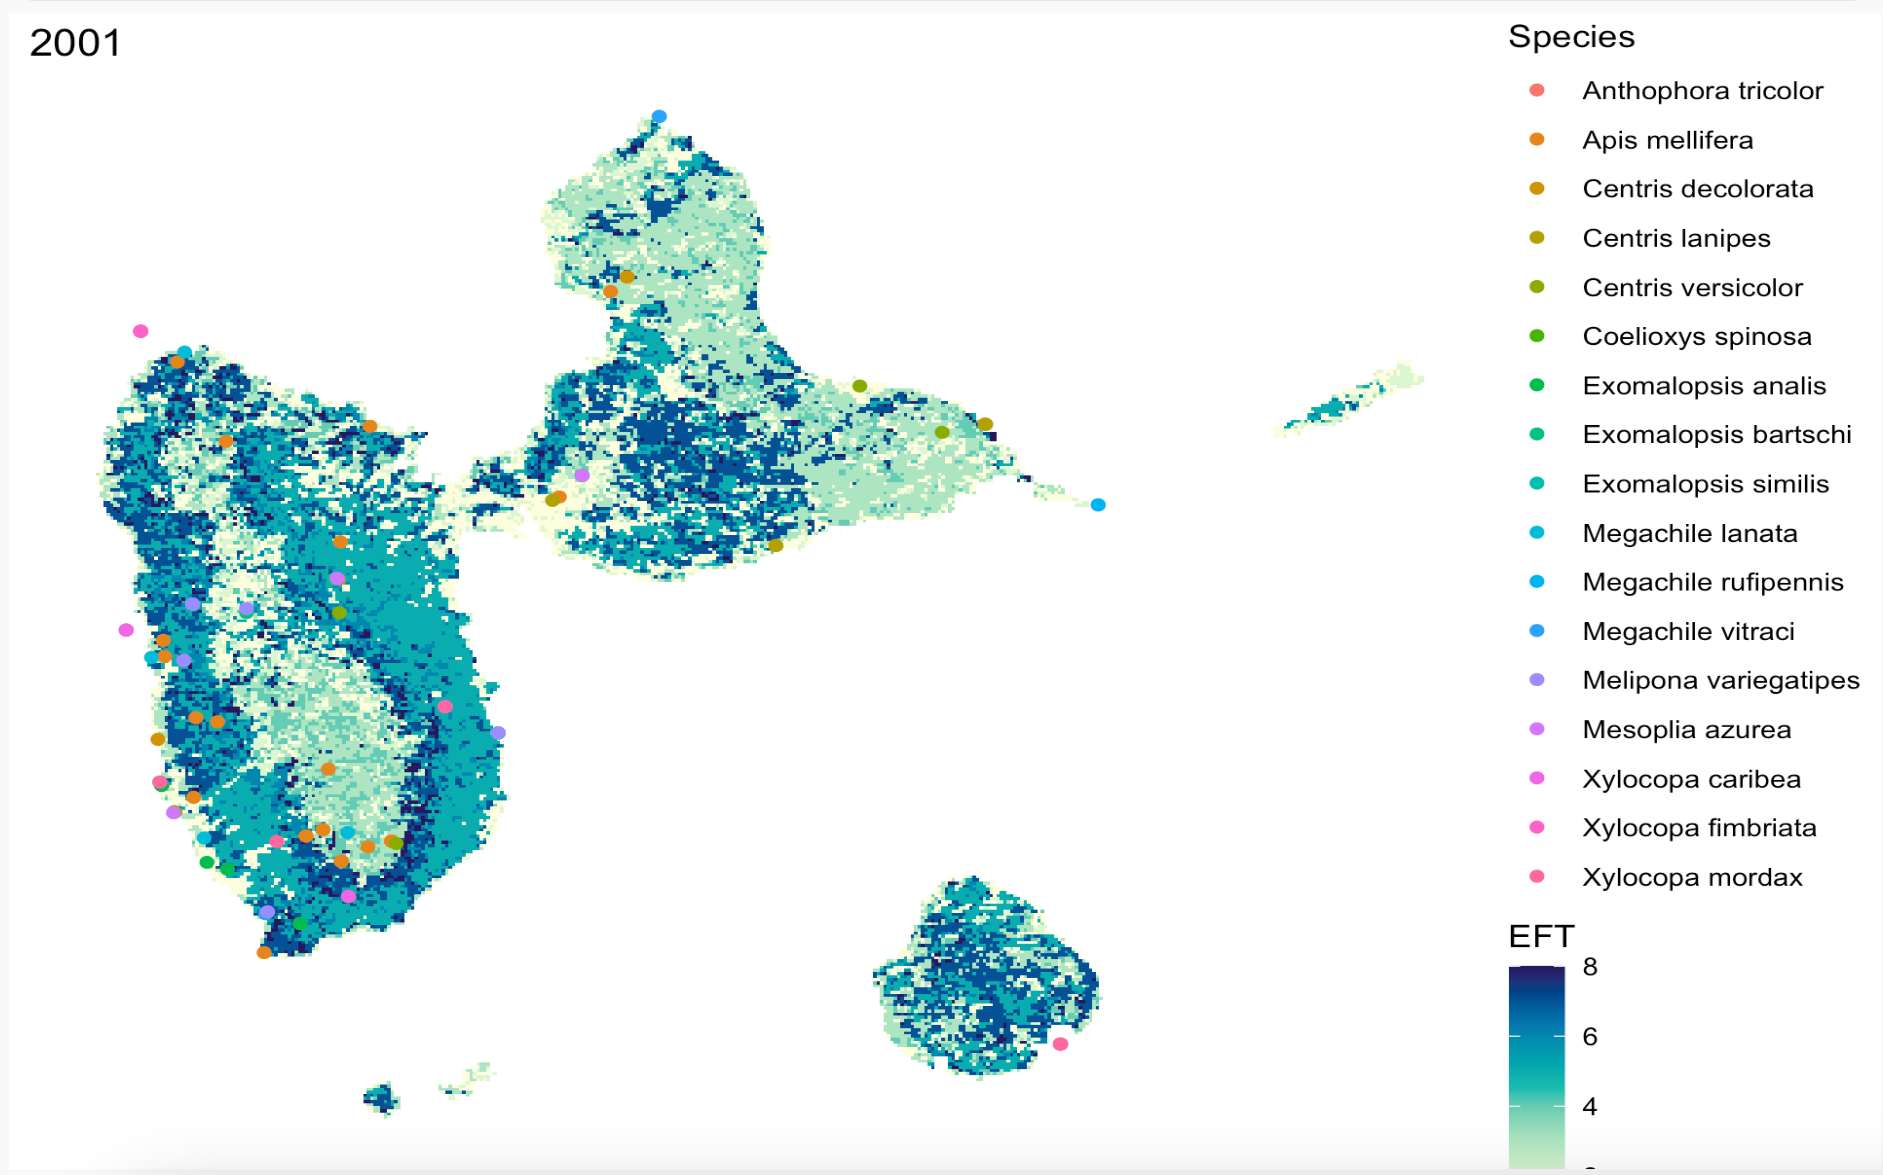
I created a plot using geom_raster and geom_sf. The raster contains the EFT values for each pixel per year, and the shape file contains a list of species with coordinates. I would like to extract the values from the raster that corresponds to each species located in the shape file. The goal is to have a table with the list of species, coordinates, Year, and EFT value. Is this possible?
Thanks, it's accessible, but I can't read the shapefile. It's extremely small, so it might have been corrupted? Is this Guadeloupe Island, Mexico in the Pacific? Can you point me to a shapefile?
Hi, I edited the shapefile and data frame so they'll be larger. Hopefully the shapefile can be read now. The shapefile contains coordinates of bee species found in Guadeloupe Island in the Caribbean. Thank you.
Yes, that is the data. I tried using ggbuild to try and see if I could export a table with the species names that are in the shapefile and the value of the pixel where the species is found (value of the raster).
DG <-ggplot_build(Test)
DG[[1]]
But I believe it gives a column with the color that represents the species, but it doesn't give a column with the value of the pixel the species is located at.
I retraced my steps to the original raster and shapefile, and converted the raster to a stars object. Then I used the st_extract function to extract, in this case, the EFD value for each individual bee observation.
The object ExtractB will have an additional column named EFD_EVI_br_2001.tif with the extracted values. I added this column to the original shapefile named Guade. Finally, I converted the shapefile to a data frame.
#Add extracted EFD values to original shapefile Guade:

Guade$`EFD_EVI_br_2001.tif` = ExtractB$`EFD_EVI_br_2001.tif`