Hi experts,
I am having trouble using fct_reorder command.
library(tidyverse)
library(readxl)
library(ggplot2)
library(reprex)
families <- tibble::tribble(
~class, ~phylum, ~family, ~genus, ~mean, ~sd,
"OTP", "ko00780", "Biotin metabolism", "Metabolism of cofactors and vitamins", 1.92, 0.04,
"OTP", "ko00860", "Porphyrin metabolism", "Metabolism of cofactors and vitamins", 0.68, 0.01,
"OTP", "ko00680", "Methane metabolism", "Energy metabolism", 0.47, 0,
"OTP", "ko00920", "Sulfur metabolism", "Energy metabolism", 0.18, 0.05,
"OTP", "ko00910", "Nitrogen metabolism", "Energy metabolism", 0.7, 0.01,
"OTP", "ko00650", "Butanoate metabolism", "Carbohydrate metabolism", 0.71, 0.01,
"OTP", "ko00630", "Glyoxylate and dicarboxylate metabolism", "Carbohydrate metabolism", 0.97, 0.01,
"OTP", "ko00330", "Arginine and proline metabolism", "Amino acid metabolism", 0.46, 0,
"OTP", "ko00633", "Nitrotoluene degradation", "Xenobiotics biodegradation and metabolism", 0.14, 0.01,
"OTP", "ko01120", "Microbial metabolism in diverse environments", "??", 0.53, 0,
"OTP", "ko02024", "Quorum sensing", "Cellular community - prokaryotes", 0.49, 0.01,
"HTP", "ko00780", "Biotin metabolism", "Metabolism of cofactors and vitamins", 2.05, 0.05,
"HTP", "ko00860", "Porphyrin metabolism", "Metabolism of cofactors and vitamins", 0.63, 0.01,
"HTP", "ko00680", "Methane metabolism", "Energy metabolism", 0.36, 0.06,
"HTP", "ko00920", "Sulfur metabolism", "Energy metabolism", 0.26, 0.04,
"HTP", "ko00910", "Nitrogen metabolism", "Energy metabolism", 0.66, 0.01,
"HTP", "ko00650", "Butanoate metabolism", "Carbohydrate metabolism", 0.68, 0.01,
"HTP", "ko00630", "Glyoxylate and dicarboxylate metabolism", "Carbohydrate metabolism", 0.94, 0.01,
"HTP", "ko00330", "Arginine and proline metabolism", "Amino acid metabolism", 0.45, 0,
"HTP", "ko00633", "Nitrotoluene degradation", "Xenobiotics biodegradation and metabolism", 0.1, 0.01,
"HTP", "ko01120", "Microbial metabolism in diverse environments", "??", 0.52, 0,
"HTP", "ko02024", "Quorum sensing", "Cellular community - prokaryotes", 0.46, 0.01
)
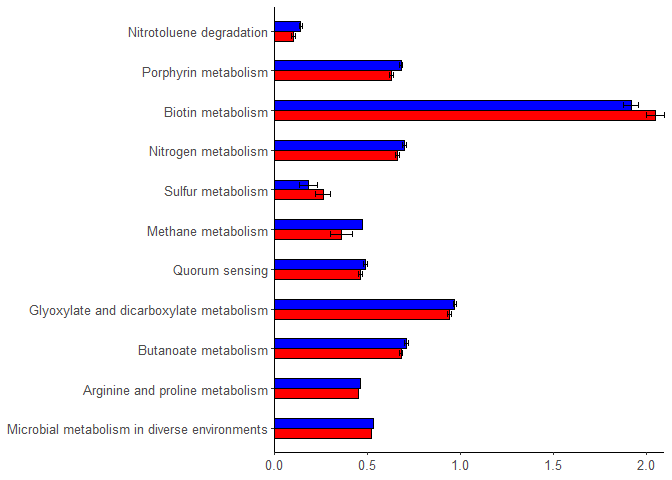
p<- ggplot(families, aes(x=family, y=mean, fill=class)) +
geom_bar(stat="identity", color="black", width = 0.5,
position=position_dodge()) + coord_flip() +
geom_errorbar(aes(ymin=mean-sd, ymax=mean+sd), width=0.3,position=position_dodge(0.5))
print(p)
# Finished bar plot
p+labs(y = "Relative abundance (%)")+
theme_classic() +
theme(legend.position = 'none') +
theme(axis.text.y = element_text(size = 10)) +
theme(axis.text.x = element_text(size = 10)) +
theme(axis.title.x = element_blank()) +
theme(axis.title.y = element_blank()) +
scale_y_continuous(expand = c(0,0)) +
scale_fill_manual(name=NULL,
breaks = c("OTP", "HTP"),
labels = c("OTP", "HTP"),
values = c ("#0000ff","#ff0000")) +
ggsave("HTPOTP_KEGGpathway.png", dpi=1000, dev='png', height=10, width=12)
Sorry. I put the syntax because the "Reprex" package was not available.
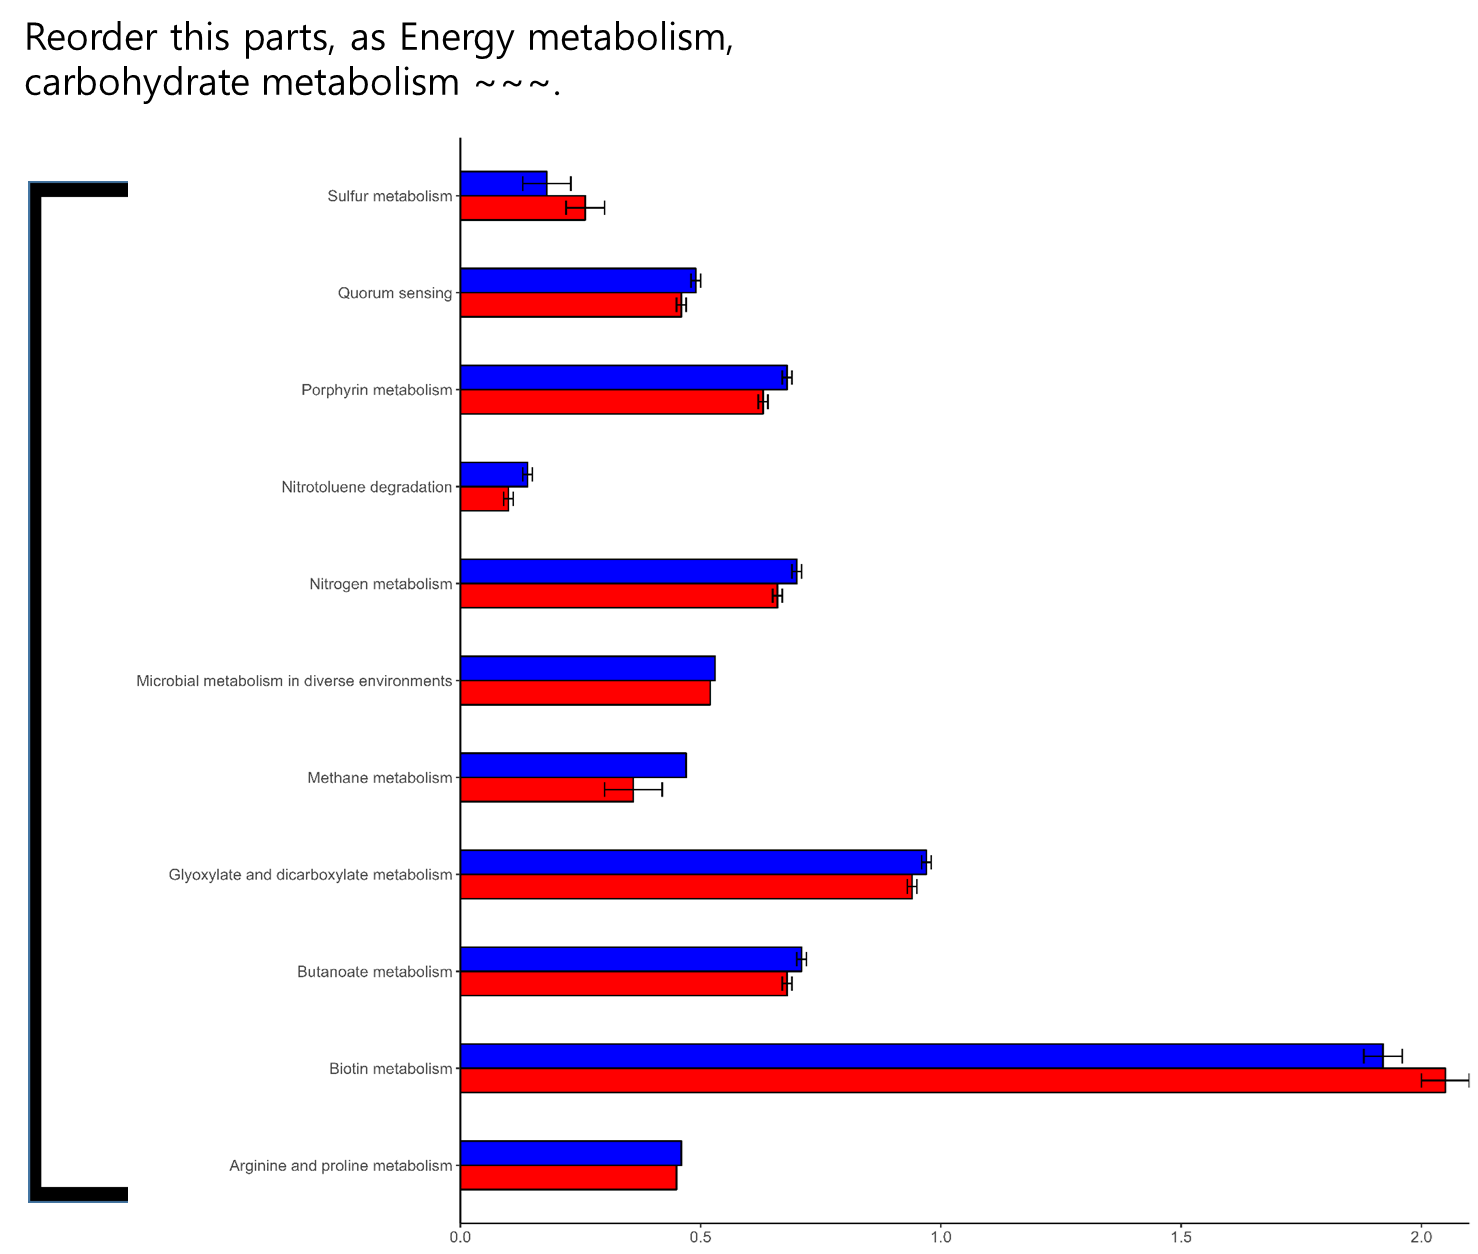
I want to rearrange these plots in "genus" order.
I think I may solve with this problem using fct_reorder, but I can't made it.
Thank you