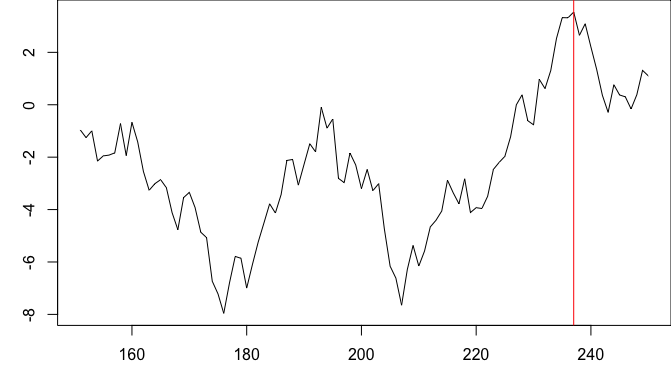
For a single peak, you can use the which.max() function, which returns the index of the maximum value in a vector:
# Fake data
set.seed(3)
y = cumsum(rnorm(100))
x = 151:250
which.max(y)
[1] 87
x[which.max(y)]
[1] 237
plot(x,y, type="l")
abline(v=x[which.max(y)], col="red")
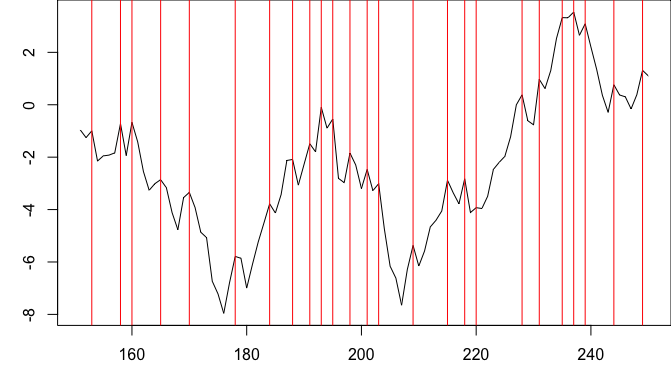
To find multiple peaks, R has many options, for example, findpeaks from the pracma package. findpeaks(y) returns a matrix, the second column of which gives the indices of the peaks.
library(pracma)

plot(x,y, type="l")
abline(v=x[findpeaks(y)[,2]], col="red")
For more information on tools for spectral analysis in R, see, for example, the CRAN Task Views for Chemometrics and Time Series.