Finding unique combinations across 2 columns...

I have a large dataframe with entries in 3 columns. For simplicity and Minimal reprex I'll relate it to colors:

Let's say I asked 4 people to combine their 2 favorite colors. Some people couldn't just pick one combination so they answered twice. How can I find out the total number of unique combinations?

"red+blue" should be the same as "blue+red".

In the reprex, there should be 3 combinations (blue_green is duplicated, and yellow_red should be the same as red_yellow).

mydf <- data.frame("person" = c("bob", "alice", "peter", "paul", "paul"),
                   "color1"=c("blue","red","green","yellow", "blue"),
                   "color2" = c("green", "yellow", "pink", "red", "green"))

#If you combine strings...                   
mydf$combined <- paste0(mydf$color1, "_", mydf$color2)
> mydf
  person color1 color2   combined
1    bob   blue  green blue_green
2  alice    red yellow red_yellow
3  peter  green   pink green_pink
4   paul yellow    red yellow_red
5   paul   blue  green blue_green
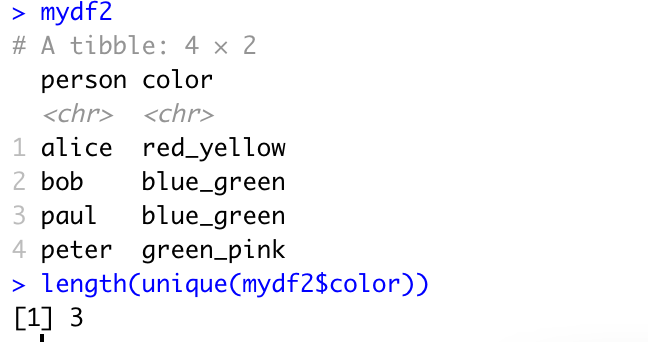
#And count the unique combined strings..
length(unique(mydf$combined))
#You get the wrong answer
[1] 4
1 Like

You need make the same values for easy count and homogenize characters.

library(dplyr)

mydf %>% mutate(combined2=
    case_when(mydf$combined  == 'red_yellow' ~ 'yellow_red', # homogenize characters
              mydf$combined  == 'yellow_red' ~ 'yellow_red', # homogenize characters
              mydf$combined  == 'blue_green' ~ 'blue_green', # homogenize characters
              mydf$combined  == 'green_pink' ~ 'green_pink'))  #homogenize characters


n_occur <- data.frame(table(mydf$combined2 ))

#    Var1       Freq
# 1 blue_green    2
# 2 green_pink    1
# 3 yellow_red    2


1 Like

Try this

library(tidyverse)

mydf <- data.frame("person" = c("bob", "alice", "peter", "paul", "paul"),
                   "color1"=c("blue","red","green","yellow", "blue"),
                   "color2" = c("green", "yellow", "pink", "red", "green"))

mydf2 <- mydf %>% 
  pivot_longer(2:3) %>% 
  select(-name) %>% 
  arrange(value) %>% 
  group_by(person) %>% 
  summarise(color = paste0(value[1], "_", value[2]))

length(unique(mydf2$color))

Schermata 2022-10-18 alle 18.11.16

2 Likes

Another option

library(dplyr)

mydf <- data.frame("person" = c("bob", "alice", "peter", "paul", "paul"),
                   "color1"=c("blue","red","green","yellow", "blue"),
                   "color2" = c("green", "yellow", "pink", "red", "green"))

mydf <- mydf %>%
    rowwise() %>% 
    mutate(combined = paste(sort(c_across(starts_with("color"))),collapse = "_"))

length(unique(mydf$combined))
#> [1] 3

Created on 2022-10-18 with reprex v2.0.2

3 Likes

This worked and was the appropriate solution that worked on a much larger dataset. Thanks!

I know a solution has been found but I wanted to address a very common mistake that I make and see in this question. When dealing with a data frame length() will return the number of columns as it is a list of vectors. To get the actual length of the data set you should use nrow() or NROW().

mydf$combined is a vector, not a data frame. Can you clarify what you mean?

This topic was automatically closed 7 days after the last reply. New replies are no longer allowed.

If you have a query related to it or one of the replies, start a new topic and refer back with a link.