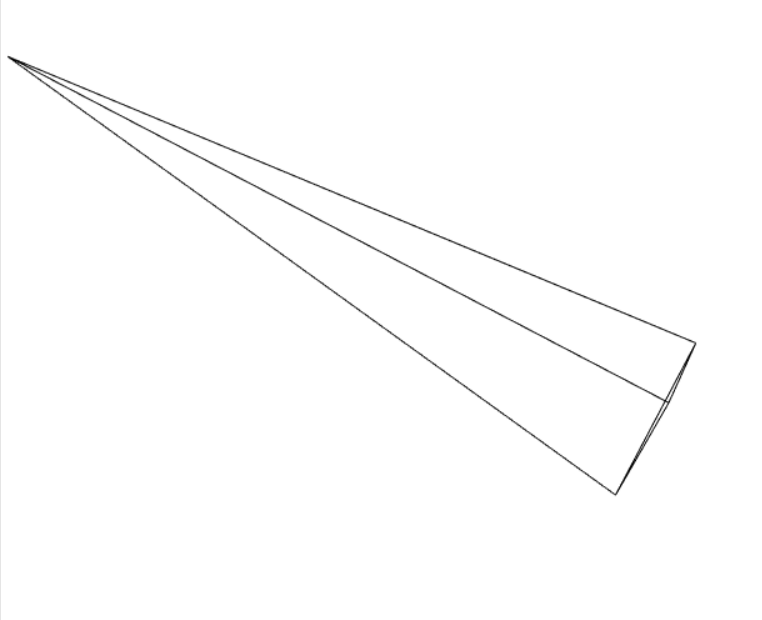
but unfortunately all i got is wired shape that
when i click on the screen its move and doing wired shapes..
i dont know how to fix that
and i am looking for help.
thank you guys and have a good evening
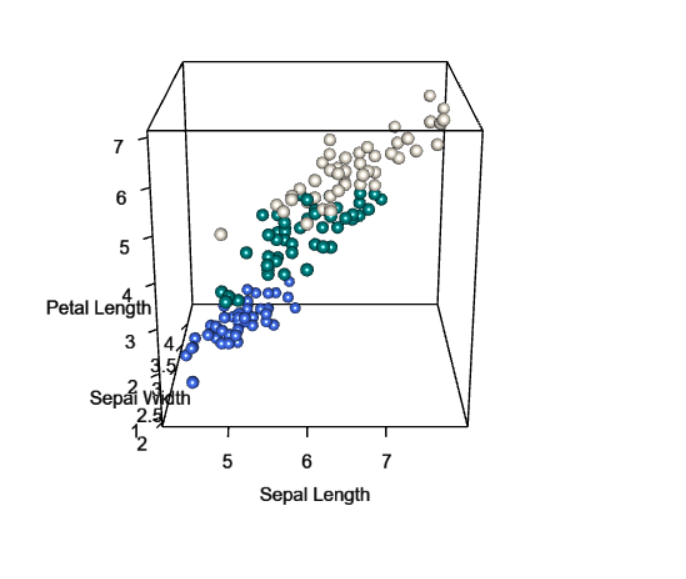
code seems fine to me, i tested on iris dataset.
Is there something odd about your data ?
if you have skewed data / a strong outlier, then it could well make all the points invisible in a viewed out wireframe box; I guess my advice is know your data, and look for outliers...
btw the console with the strange shape look like that
like i had said when i hold my left mouse clicker on this console and start to move this shape changes
Hello.
Thanks for providing code , but you could take further steps to make it more convenient for other forum users to help you.
Share some representative data that will enable your code to run and show the problematic behaviour.
You might use tools such as the library datapasta, or the base function dput() to share a portion of data in code form, i.e. that can be copied from forum and pasted to R session.
the variables distance.Length etc to plot3d are not in data$ ...
p.s. the flight data is huge, trying to plot so many elements will likely take a long time on your computer