So I'm trying to make a histogram with ggplot where I am trying to zoom in the axis on the a graph, but I still want all my bars to be present. So I have the dataframe below:
> dput(organic_acids_28day_merged_numeric)
structure(list(Sample = c("Ana 28day", "Ana 28day", "Ana 28day",
"Ana 28day", "Ana 28day", "Ana 28day", "Ana 28day", "CA 28day",
"CA 28day", "CA 28day", "CA 28day", "CA 28day", "CA 28day", "CA 28day"
), Acid = c("Acetic Acid", "Butyric Acid", "Isovaleric Acid",
"Lactic Acid", "Propionic Acid", "Succinic Acid", "Valeric Acid",
"Acetic Acid", "Butyric Acid", "Isovaleric Acid", "Lactic Acid",
"Propionic Acid", "Succinic Acid", "Valeric Acid"), Percent = c(3.06,
2.5, 0.42, 0.3, 2.78, 1.01, 0, 2.49, 0.03, 2.48, 1.3, 2.09, 29.68,
0), stdev = c(0.78, 0.34, 0.23, 0.13, 0.37, 0.3, 0, 0.41, 0.05,
1.28, 0.32, 0.19, 6.81, 0)), class = "data.frame", row.names = c(NA,
-14L))
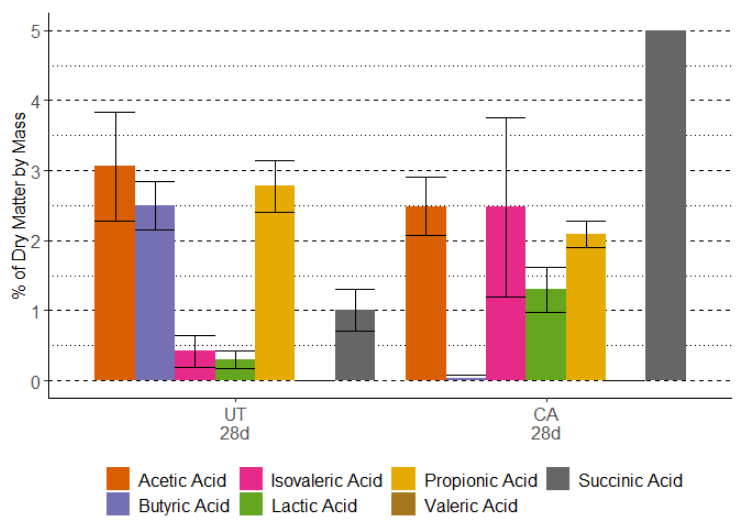
And when I don't try to fix the axes I get all the data points showing up fine. But when I zoom into the axis, as with the code below (adjusting the y-axis to be betwen 0 and 5) it completely removes the bar that goes up to about 30%. And I get the error after it:
> ggplot(organic_acids_28day_merged_numeric,
+                   aes(x=factor(Sample,level=c("Ana 28day","CA 28day")),
+                       y=Percent,fill=factor(Acid,level=c("Acetic Acid",
+                                                          'Butyric Acid',
+                                                          'Isovaleric Acid',
+                                                          'Lactic Acid',
+                                                          'Propionic Acid',
+                                                          'Valeric Acid',
+                                                          'Succinic Acid'))))+
+   geom_col(position=position_dodge())+
+   labs(x="None",y="% of Dry Matter by Mass")+
+   scale_x_discrete(labels=c("UT\n28d","CA\n28d"))+
+   scale_y_continuous(limits=c(0,5))+
+   geom_errorbar(aes(ymin=Percent-stdev,
+                     ymax=Percent+stdev),
+                 position=position_dodge())+
+   scale_fill_manual(values=c("#D95F02","#7570B3","#E7298A","#66A61E","#E6AB02",
+                              "#A6761D","#666666"))+
+   # scale_fill_brewer(palette="Dark2")+
+   theme_classic()+
+   theme(axis.title.x=element_blank(),legend.title=element_blank(),
+         legend.text =element_text(size=12),axis.title.y=element_text(size=12),
+         legend.position="bottom",axis.text.x=element_text(size=12),
+         axis.text.y=element_text(size=12),
+         panel.grid.major.y=element_line(color=1,size=0.5,linetype=2),
+         panel.grid.minor.y=element_line(color="black",size=0.25,linetype=3))
Warning message:
Removed 1 rows containing missing values (`geom_col()`).
And I know it's removed because the value is outside the y-axis limit. But I wanted to know if there is a way to fix this so that it still shows that last bar being present, even if it would be cut off, if that makes sense.