Hello a good day,
Due to too little experience with tables in R, figuring out my problem is taking too long.
Exporting my table to PowerPoint works well. But formatting is not what I want. Because the font size is way to big. That's why I started with flextable.
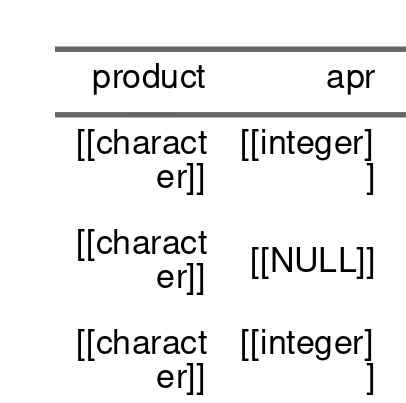
Sadly flextable is only printing data type names and not the actual data (values).
Once a as.data.frame function made it so that the characters (strings) came correct trough, but I don't have clear how to force data type conversion for the columns (in flextable).
I think daply is cousing the problem. I do want to pivot. The column values for "month" must go to the (12) columns. After daply my data consists of a list of lists perhaps this is causing the problem.
Hope you can help.
Greetings!
'''r
library(flextable)
library(officer)
library(plyr)
date <- c("mrt","feb","okt","feb","jan","jul","may","aug","sep","mrt","feb",
"okt","aug","nov","okt","may","jun","sep","dec","feb","okt","feb",
"nov","okt","may","jun","apr","mrt","feb","okt","feb","nov","may",
"may","jun","dec","mrt","feb","okt","feb","jan","jul","may","aug",
"sep","mrt","feb","okt","aug","nov","okt","may","jun","sep","dec",
"feb","okt","feb","nov","okt","may","jun","apr","mrt","feb","okt",
"feb","nov","may","may","jun","dec","may","jun","apr","mrt","feb",
"okt","feb","nov","may","may","jun","apr","mrt","feb","okt","feb",
"nov","may","may","jun","apr","mrt","feb","okt","feb","nov","may",
"may","jun")
amount <- c(1,1,1,1,1,1,1,1,1,1,1,1,1,1,1,1,1,1,1,1,1,1,1,1,1,1,1,1,1,1,1,1,
1,1,1,1,1,1,1,1,1,1,1,1,1,1,1,1,1,1,1,1,1,1,1,1,1,1,1,1,1,1,1,1,
1,1,1,1,1,1,1,1,1,1,1,1,1,1,1,1,1,1,1,1,1,1,1,1,1,1,1,1,1,1,1,1,
1,1,1,1,1)
product <- c("cycle","bal","bat","tricycle","cycle","bat","bal","skateboard",
"bell","cycle","bal","bat","tricycle","cycle","bat","bal",
"skateboard","bell","cycle","bal","bat","tricycle","cycle","bat",
"bal","skateboard","bell","cycle","bal","bat","tricycle","cycle",
"bat","bal","skateboard","bell","bell","cycle","bal","bat",
"tricycle","cycle","bat","bal","skateboard","bell","cycle","bal",
"bat","tricycle","cycle","bat","bal","skateboard","bell","cycle",
"bal","bat","tricycle","cycle","bat","bal","skateboard","bell",
"cycle","bal","bat","tricycle","cycle","bat","bal","skateboard",
"bell","bat","bal","skateboard","bell","cycle","bal","bat",
"tricycle","cycle","bat","bal","skateboard","bell","cycle","bal",
"bat","tricycle","cycle","bat","bal","skateboard","bell","cycle",
"bal","bat","tricycle","cycle","bat")
data <- data.frame(date, amount, product)
data <-
aggregate(data.frame(amount = data$amount),
list(product = data$product, date = data$date), length)
pptx <- read_pptx()
#######
data <- daply(data, .(product, date), summarize, sum(amount))
data <- cbind(product = rownames(data), data)
#######
rownames(data) <- NULL
pptx <- add_slide(pptx, layout = "Title and Content", master = "Office Theme")
pptx <- ph_with(pptx, value = "", location = ph_location_type(type = "body"))
head(data)
data <- flextable(data.frame(data))
pptx <- ph_with(pptx, value = data, location = ph_location_type(type = "body"))
print(pptx, "file.pptx")
'''