Previously, I usually save plots as both png and pdf using ggsave(), and I'm used to them turning out identical. However recently my png-plot looks really strange, the font gets very small compared to the pdf. I have found previous posts here that seem to have the exact same problem, see Font size changes when saving in 'png' files, not in 'pdf' or 'svg' and ggsave png super small text.
I noticed that this only happens when I use the package showtext, without necessarily changing the font, just calling showtext_auto(). But again, I have used showtext before without this issue (and it looks like only one of the above linked examples uses showtext).
I have tried specifying width and height, dpi, and units to ggsave(), and none of that seems to help. I'm confused, as this has worked just fine previously. I'm using R version 4.2.0.
The following code produces two different plots for me:
library(ggplot2)
library(showtext)

showtext_auto()

df <- data.frame(x = runif(10), y = runif(10))

p <- ggplot(df, aes(x = x, y = y)) +
  geom_point() +
  labs(title = "The title of the plot",
       subtitle = "This plot illustrates how the font gets all small \nwhen saving to png")

p
ggsave("font_size_issue.png")
ggsave("font_size_issue.pdf")
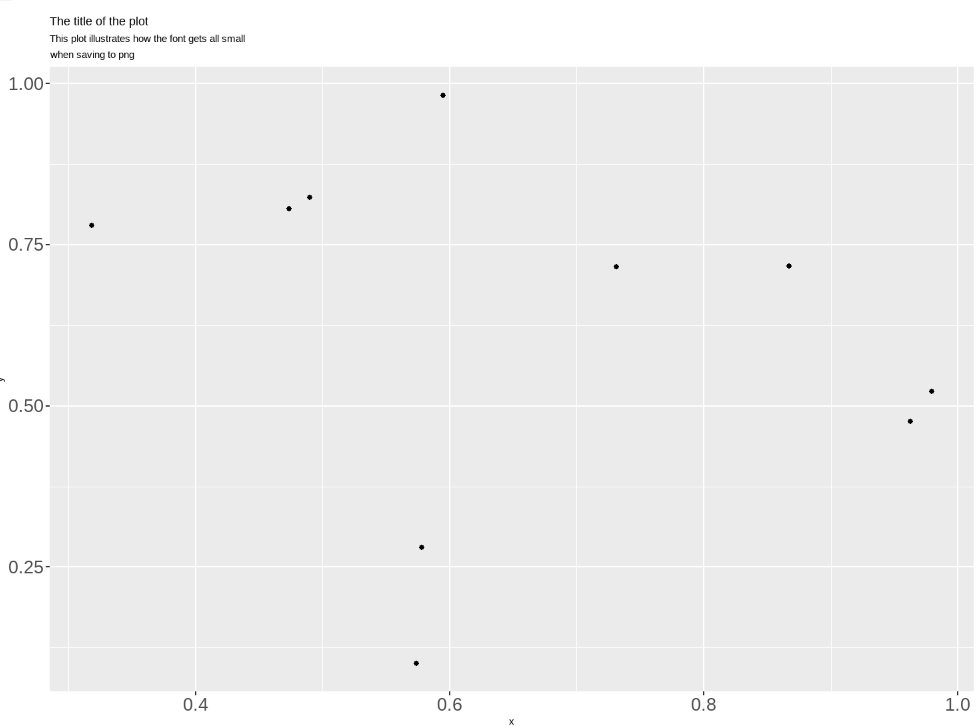
This is the png:
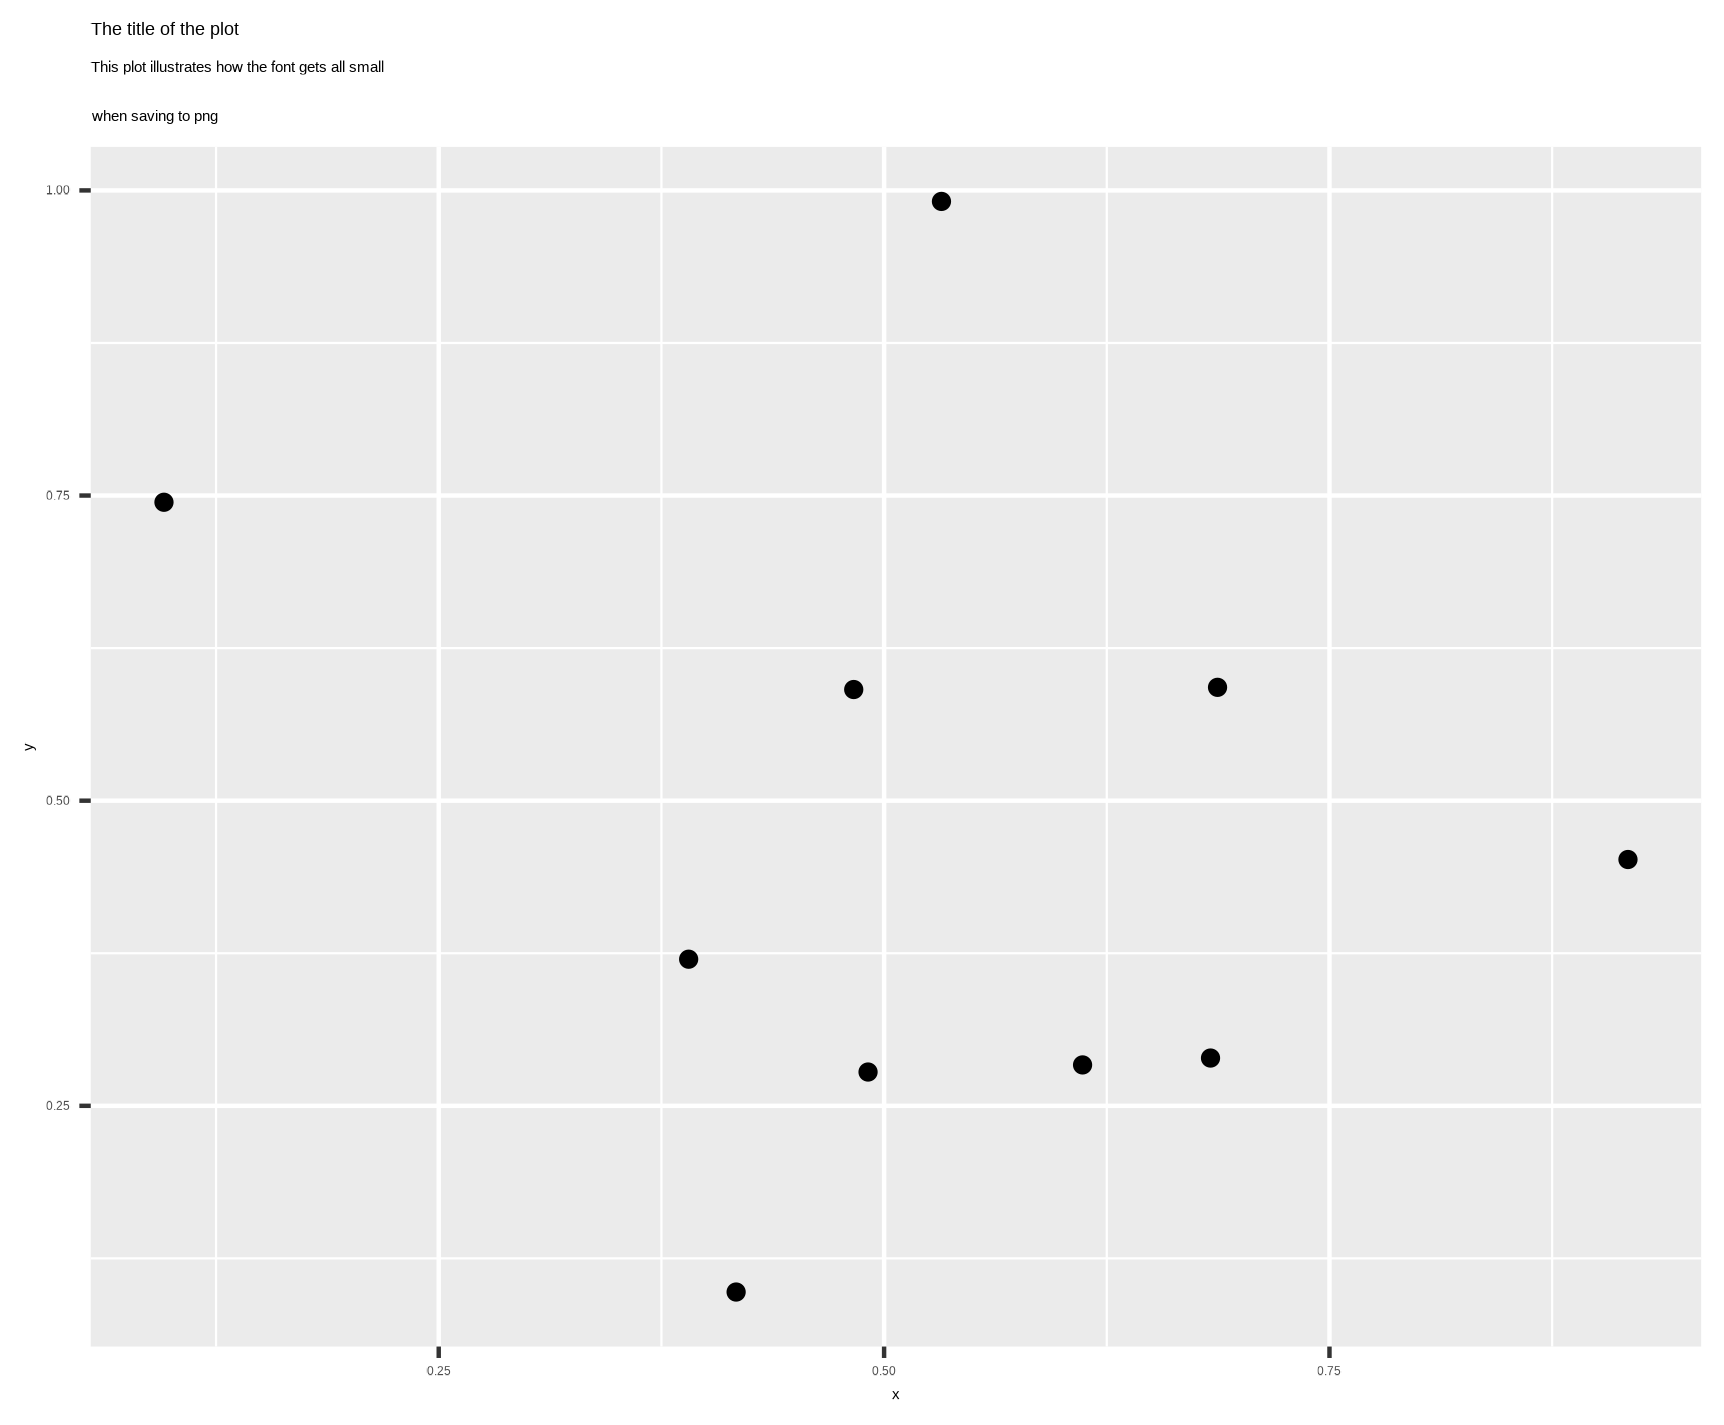
However, if I instead save it like this, the png looks like I want it to (if I specify the same width and height it looks identical to the pdf):
png("font_size_issue_fixed.png", width = 5.75, height = 4.75, res = 300, units = "in")
print(p)
dev.off()
So doing it like this sort of solves my problem, but I would really prefer to use ggsave()! Any ideas as to what may cause this and how to save an identical plot using ggsave()?