Forecast with AR, MA and ARIMA models look all equal and false

Thanks a lot technocrat for your answer,

maybe one (hopefully) last question. You said that I should make the data stationary before applying the ARIMA models. But does the ARIMA models not do this themselves? As far as I understood in ARIMA(p,d,q) models the d part stands for differencing to make a time series stationary.

Good catch. Yes, although sometimes we want to tweak the ARIMA arguments manually. My reason is that if we know there is auto-correlation and want to compare models, they should all be on a common footing with first-order differencing. However, I did not check to see if ARIMA takes differenced data and re-differences them, but probably not.

Thanks technocrat for your answer once again,

I have to admit that I do not really understand your last post. So did you basically make the time series stationary before applying the ARIMA approach? As said before, when you input your time series to ARIMA it should basically make it automatically stationary (either through AUTOARIMA or the H-K algorithm, as far as I understood). So when making the time series stationary before the input then applying those methods would yield a second iteration of making it stationary and I can imagine that this might yield worse results.

I checked it and for ARIMA with my data, the differenced data input and un-differenced had the same result. Let me know if that's not your experience.

1 Like

Hi technocrat,
it's me again having a question and comment. So I had a look at the "Hyndman-Khandakar algorithm" and the procedure for fitting an ARIMA model that is described here https://otexts.com/fpp3/arima-r.html

I have some follow up questions:

  1. As far as I understood, the autoarima function of the forecast package uses the Hynman-Khandakar algorithms for parameter selection. So I do not have to apply it on my own, right?

  2. You wrote that I should use the AIC to decide about my model. Now in the R forecast package the AIC value I think is given by "aic: num 1307". What exactly does this mean? Is a lower AIC value better or a higher one?

  3. Further it is oftern stated (and you also wrote it) that I should check whether the residuals are like white noise. Bascially for me they look like white noise but is there a command in R which I can use to check this easily?

I'd appreciate any further comments from you.

The arima functions in the fpp2/fpp3 suites do apply the Hyndman-Khandakar algo automatically.

Lower AIC is better among the same type of model, but not necessarily across types. (See the text)

The acf/pacf functions and Box-Ljung tests mentioned in the text handle stationarity (white noise).

1 Like

Thanks technocrat for your further answer and generally for your effort, I really appreciate it,

so for me there are still several confusing things. It is often said, that I should check from the ACF and PACF plot, whether the order of the AR and MA model are appropiate when using autoArima. The autoArima function infers the order of AR to be 4 and MA to be 2 and I part is 1. However, when I plot the ACF I see high values until a leg of more than 20 and in the PACF plot I see it unitl lag 3. I remember reading that the lag of the ACF plot with high values should be used as the order of the MA model, and the PACF plot should be used for the AR order. So according to the ACF and PACF plots the order of the ARIMA should be ARIMA(3,1,20) instead of the automatically inferred ARIMA (4,1,2).

So now here is the problem (this is why I asked about the direction of the AIC value). The autoArima model has an AIC value of 1340 while the 'manually' created ARIMA model, having used the ACF and PACF plots, has a much higher AIC value of 3460. This is quite strange for me. Do you have any idea why this is happening?

Let's make this concrete. Add your models and diagnostic with the reprex below?

suppressPackageStartupMessages({
  library(fpp3)
})

Time <- seq(
  from = as.POSIXct("2021-1-1 0:00", tz = "UTC"),
  to = as.POSIXct("2021-2-11 15:00", tz = "UTC"),
  by = "hour"
)

DAT <- data.frame(Time,
  observed =
    c(
      10.07, -4.08, -9.91, -7.41, -12.55, -17.25, -15.07, -4.93,
      -6.33, -4.93, 0.45, 0.12, -0.02, 0, -0.03, 1.97, 9.06, 0.07,
      -4.97, -6.98, -24.93, -4.87, -28.93, -33.57, -45.92, -48.29,
      -44.99, -48.93, -29.91, -0.01, 37.43, 48.06, 50.74, 47.57, 43.94,
      40.97, 44.95, 49.64, 53.67, 56.01, 56.95, 62.08, 62.11, 57.99,
      55.64, 55.13, 50.76, 42.91, 45.22, 45.63, 44, 43.88, 45.92, 51.07,
      52.77, 62.89, 60.03, 58.19, 62.99, 63.52, 64.67, 65.24, 67.76,
      68.41, 69.55, 67.28, 69.46, 68.38, 61.72, 53.72, 49.98, 50.73,
      47.11, 47.07, 46.94, 47, 46.91, 49.59, 55.32, 55.78, 55.52, 55.23,
      53.58, 51.74, 51.6, 51.41, 51.69, 52.59, 54.66, 54.1, 51.89,
      46.58, 45.43, 43.96, 31.41, 26.9, 25.12, 24.12, 22.04, 18.37,
      22.09, 23.35, 28.76, 36.63, 40.46, 45.85, 49.8, 51.36, 51.74,
      51.92, 53.22, 56.62, 56.92, 61.64, 59.44, 52.75, 51.9, 51.38,
      49.96, 50.29, 47.72, 48.38, 48.02, 44.23, 47.17, 48.19, 49.11,
      50.44, 53.4, 56.55, 60.02, 60.22, 55, 52.39, 51.57, 54.71, 63.43,
      67.37, 67.2, 66.03, 55.36, 58.59, 53.7, 46.03, 47.98, 47.84,
      46.11, 46.08, 47.62, 55.77, 68.61, 74.15, 74.93, 73.59, 71.23,
      68.79, 66.75, 62.47, 53.25, 53.26, 53.42, 47.91, 42.05, 40.96,
      32.04, 20.82, 1.84, 17.94, 20.91, 7.78, 14.33, 18.56, 18.57,
      35.81, 43.87, 46.93, 43.88, 43.85, 46.74, 43.94, 43.21, 43.81,
      45.6, 35.21, 45.64, 45.63, 37.94, 39.53, 35.97, 29.72, 22.55,
      20.04, 7.24, 3.43, 10.04, 14.2, 25.41, 36.98, 43.89, 50.98, 50.3,
      50.21, 45.8, 43.64, 43.49, 45.05, 49.95, 53.82, 55.94, 54.19,
      54.19, 52.98, 51.68, 48.95, 47.63, 46.48, 49.08, 47.11, 48.8,
      48.5, 49.8, 56.97, 72.6, 81.17, 81.79, 81.15, 80, 76.39, 75,
      76.06, 75.4, 76.78, 83.45, 85.15, 78.16, 71.92, 67.43, 60.49,
      54.45, 47.84, 46.58, 45.74, 43.81, 46.24, 46.46, 51.29, 60.53,
      60.02, 62.92, 61.58, 60.6, 51.89, 50.8, 45.46, 42.2, 45, 51.51,
      48.59, 49.2, 44.99, 44.93, 46.4, 43.46, 47.24, 45.88, 44.61,
      42.9, 42.03, 39.33, 42.98, 41.23, 42.12, 45.1, 44.27, 44.18,
      42.05, 38.61, 37.76, 33.03, 35.84, 44.24, 46.29, 40.05, 38.15,
      30.26, 40.2, 30.89, 23.35, 12.4, 19.01, 23.51, 23.25, 20.01,
      20.8, 22.14, 23.68, 25.05, 26.3, 30.81, 27.06, 8.5, -0.08, -0.01,
      -0.27, 21.55, 24.04, 15.91, -0.02, -0.33, 3.04, -7.28, -3.14,
      -12, -15.04, -11.09, -4.94, 1.59, 35.9, 51.22, 51.66, 46.09,
      50.26, 44.49, 41.24, 38.91, 41.79, 49.63, 50.93, 51.25, 50.93,
      50.52, 49.61, 44.3, 41.29, 37.26, 35.18, 35.82, 34.99, 34.56,
      30.8, 33.41, 47.4, 53.73, 57.02, 58.38, 56.54, 55, 53.92, 53.31,
      52.63, 52.12, 51, 53.91, 46.35, 42.73, 40.32, 39.93, 39.66, 32.04,
      29.23, 29.26, 32.64, 32.41, 33.06, 33.22, 46.63, 53.8, 55.73,
      53.83, 54.22, 54.92, 53.65, 52.69, 53.55, 53.72, 54.83, 54.01,
      52.67, 50.92, 39.81, 39.29, 39.91, 30.77, 26.35, 25.23, 22.77,
      24.02, 25.63, 28.06, 35.38, 46.04, 49.96, 50.56, 46.1, 46.02,
      43.94, 46.64, 55, 55.9, 57.43, 58.72, 55.06, 53.85, 49.52, 42.35,
      42.44, 41.11, 42.26, 40.91, 43.77, 45.05, 47.89, 49.79, 54.77,
      73.08, 76.86, 74.32, 70.51, 69.02, 68.94, 65.27, 67.44, 68.14,
      69, 75.04, 76.13, 72.46, 61.83, 59.24, 56.7, 53.16, 52.47, 53.18,
      54.73, 51.15, 52.25, 50.93, 49.04, 50.56, 55.71, 56.62, 63.13,
      57.33, 55.26, 54.38, 52.55, 55.41, 62.93, 67.15, 68.91, 57.37,
      54.61, 52.32, 51.53, 49.8, 47.74, 47.01, 48.8, 48.9, 49.63, 49.53,
      46.69, 46.76, 50.88, 52.38, 50.07, 49.33, 48.98, 47.4, 53.2,
      55.39, 58.02, 66.68, 69.43, 69.75, 67.83, 57.37, 59.56, 52.07,
      55.54, 53.02, 52.1, 51.31, 51.14, 53.23, 67.16, 79.62, 88.06,
      86.01, 80.04, 75, 70.65, 71.56, 72.03, 76.49, 81.08, 88.35, 88.5,
      79.93, 73.69, 68.34, 59.83, 54.93, 54.19, 54.05, 53.52, 51.97,
      51.96, 52.03, 62.33, 73.91, 80.23, 76.6, 74.19, 70.06, 62.07,
      58.45, 59.69, 65.09, 70.21, 78.8, 74.13, 64.46, 58.34, 55.38,
      56.59, 53.72, 53.2, 53.92, 53.11, 51.19, 51.02, 55.05, 63.96,
      82.55, 92.15, 93.65, 91.93, 88.07, 84.96, 83.99, 85.59, 86.87,
      84.96, 90.01, 93.76, 90.54, 78.49, 68.93, 65.1, 59, 61.88, 59.08,
      57.9, 56.37, 56.95, 61.53, 75.98, 99.07, 113.07, 111.23, 108.25,
      103.69, 98.33, 92.63, 89.86, 90.45, 95.01, 106.82, 121.46, 102.06,
      89.34, 74.43, 69.92, 63.79, 64.63, 60.64, 57.8, 55.44, 55.28,
      58.98, 71.1, 84.48, 97, 93.64, 85, 78, 71.81, 69.87, 68.64, 65.58,
      65.08, 70.87, 71.74, 58.51, 50.78, 51.12, 47.16, 42.9, 44.29,
      42.61, 42.51, 41.96, 41.65, 40.72, 41.53, 42.36, 51.37, 56.28,
      58.62, 59.18, 56.72, 57.44, 53.32, 52.8, 52.44, 55.95, 57.92,
      53.78, 47.98, 44.99, 43.9, 37.75, 28.42, 24.48, 19.98, 18.13,
      13.61, 15.34, 3.65, 24.47, 27.04, 32.97, 39.06, 44.05, 46.86,
      42.97, 41.18, 40.5, 41.18, 47.25, 52.64, 52.96, 50.44, 47.74,
      50.82, 44.81, 42.4, 40.97, 40.42, 37.8, 38.09, 41.83, 53.09,
      64.04, 64.88, 62.2, 58.38, 55.92, 55.12, 51.36, 48.63, 47.34,
      48.83, 60.83, 59.64, 54.37, 47.54, 45.69, 46.36, 43.91, 44.87,
      48.07, 47.49, 44.59, 45.97, 46.46, 55.82, 67.67, 72.8, 70.63,
      70.38, 67.51, 64.03, 63.84, 66.56, 66, 69.33, 71.45, 72.82, 69.81,
      59.51, 55.74, 53.83, 49.34, 46.52, 46.36, 45.1, 42.85, 42.74,
      46.34, 52.09, 64.99, 68.17, 66.76, 59.06, 53.03, 54.19, 49.7,
      53.56, 49.37, 52.65, 60.49, 62.53, 59.28, 50.02, 51.01, 50.08,
      46.86, 47.17, 45.47, 45.43, 46.82, 45.08, 48.7, 62.41, 71.7,
      78.49, 69.08, 67.35, 67.94, 66.81, 66.22, 66.16, 66.16, 65.35,
      66.68, 66.98, 65.4, 59.9, 52.84, 51.36, 46.72, 43.55, 45.47,
      43.1, 41.1, 41.51, 45.76, 47.72, 54.04, 56.66, 55.93, 55.51,
      56.9, 58.51, 64, 64.93, 64.55, 63.91, 67.71, 69.98, 67.34, 62.99,
      55.32, 54.01, 50.92, 50.04, 47.07, 45.7, 43.14, 42.71, 42.6,
      43.47, 47.68, 51.47, 55.79, 59.5, 59.15, 56.08, 50.33, 49.09,
      48.6, 49.39, 56.86, 57.91, 54.59, 50.43, 48.48, 48.49, 46.06,
      44.8, 41.29, 40.48, 39, 38.9, 38.47, 39.88, 40.97, 43.8, 47.05,
      49.33, 51.11, 50.35, 47.09, 45.14, 44.4, 45.79, 51.94, 59.54,
      57.94, 54.69, 51.94, 51.04, 46.42, 43.7, 41.37, 40.48, 39.21,
      38.55, 40.71, 49.05, 60.67, 58.93, 55.47, 48.15, 43.46, 41.69,
      40.47, 41.01, 43.37, 43.82, 49.06, 46.78, 42.08, 39.42, 38.75,
      38.52, 32.51, 34.49, 36.71, 38.42, 39.39, 39.82, 41.72, 50.31,
      61.52, 62.31, 62.31, 64.56, 62.85, 58.63, 57.81, 57.96, 58.04,
      60.35, 63.06, 65.79, 62.63, 61.77, 53.38, 50.12, 46.98, 42.8,
      41.63, 40.98, 40.4, 41.38, 42.31, 51.1, 57.59, 59.01, 53.34,
      53.54, 53.32, 53.19, 52.81, 52.93, 54.3, 56.73, 60.27, 62.4,
      59.62, 55.8, 50.49, 49.5, 46.18, 46.25, 45.21, 41.24, 38.05,
      37, 39.04, 48.06, 53.29, 53.04, 51.98, 51.47, 46.38, 43.24, 42.32,
      40.75, 41.63, 41.77, 51.37, 51.4, 45.75, 46.07, 41.47, 38.71,
      33.68, 32.73, 33.24, 32.57, 31.16, 35.71, 38.99, 45.85, 56.33,
      57.94, 54.91, 51.35, 50.66, 44.59, 39.51, 38.77, 42.31, 43.98,
      49.61, 50.66, 46.04, 35.88, 33.96, 27.56, 24.47, 0.02, 0.08,
      -4.09, -4, 0.06, 0.09, 0.05, 6.37, 12.08, 11.18, 10.64, 4.12,
      0.05, -0.1, -2.05, 0.09, 9.64, 26.97, 36.17, 25.97, 16.96, 0.09,
      12.91, 0.09, 22.88, 16.16, 16.02, 12.45, 10.19, 14.51, 7.01,
      10.98, 20.62, 32.95, 36.75, 38.68, 32.5, 34, 31.2, 27.99, 32.61,
      39.41, 49.19, 49.48, 43.1, 28.99, 34.37, 30.58, -0.01, -1.22,
      -0.04, -3.54, -3.95, 5.65, 39.91, 49.04, 49.41, 44.99, 39.94,
      38.73, 36.59, 38.54, 38.66, 38.86, 38.61
    )
)

dat <- tsibble(DAT, index = Time)

Thanks technocrat for your comment and effort,
I do not really understand what you mean by " Add your models and diagnostic with the reprex below?"

Anyways, I just post the code that I used for doing the analysis

install and import Forecast package
install.packages("forecast")
library(forecast)

#Calculate ARIMA models based on the first 200 entries (hours)

arima3_1_20_model<-Arima(ts(price[0:200]), order=c(3,1,20))
autoArima_model<-auto.arima(ts(price[0:200]))

#ACF and PACF
A_function <- acf(ts(price[0:200]), plot = FALSE, lag.max =200)
plot(A_function, xaxt = 'no', xlim = c(1,200), main="ACF of electricity prices")
P_function <- Pacf(ts(price[0:200]), plot = FALSE, lag.max =200)
plot(P_function, xaxt = 'no', xlim = c(1,200), main="PACF of electricity prices")

#Forecasted values
forecastedVal_arima3_1_20 <- forecast(arima3_1_20_model,h=24, level=c(99.5))
forecastedVal_autoArima_model <- forecast(autoArima_model,h=24, level=c(99.5))

Here's what I meant. Can you specify the commented out fit2 at the bottom and post back the reprex?

suppressPackageStartupMessages({
  library(fpp3)
  library(patchwork)
})

Time <- seq(
  from = as.POSIXct("2021-1-1 0:00", tz = "UTC"),
  to = as.POSIXct("2021-2-11 15:00", tz = "UTC"),
  by = "hour"
)

DAT <- data.frame(Time,
  observed =
    c(
      10.07, -4.08, -9.91, -7.41, -12.55, -17.25, -15.07, -4.93,
      -6.33, -4.93, 0.45, 0.12, -0.02, 0, -0.03, 1.97, 9.06, 0.07,
      -4.97, -6.98, -24.93, -4.87, -28.93, -33.57, -45.92, -48.29,
      -44.99, -48.93, -29.91, -0.01, 37.43, 48.06, 50.74, 47.57, 43.94,
      40.97, 44.95, 49.64, 53.67, 56.01, 56.95, 62.08, 62.11, 57.99,
      55.64, 55.13, 50.76, 42.91, 45.22, 45.63, 44, 43.88, 45.92, 51.07,
      52.77, 62.89, 60.03, 58.19, 62.99, 63.52, 64.67, 65.24, 67.76,
      68.41, 69.55, 67.28, 69.46, 68.38, 61.72, 53.72, 49.98, 50.73,
      47.11, 47.07, 46.94, 47, 46.91, 49.59, 55.32, 55.78, 55.52, 55.23,
      53.58, 51.74, 51.6, 51.41, 51.69, 52.59, 54.66, 54.1, 51.89,
      46.58, 45.43, 43.96, 31.41, 26.9, 25.12, 24.12, 22.04, 18.37,
      22.09, 23.35, 28.76, 36.63, 40.46, 45.85, 49.8, 51.36, 51.74,
      51.92, 53.22, 56.62, 56.92, 61.64, 59.44, 52.75, 51.9, 51.38,
      49.96, 50.29, 47.72, 48.38, 48.02, 44.23, 47.17, 48.19, 49.11,
      50.44, 53.4, 56.55, 60.02, 60.22, 55, 52.39, 51.57, 54.71, 63.43,
      67.37, 67.2, 66.03, 55.36, 58.59, 53.7, 46.03, 47.98, 47.84,
      46.11, 46.08, 47.62, 55.77, 68.61, 74.15, 74.93, 73.59, 71.23,
      68.79, 66.75, 62.47, 53.25, 53.26, 53.42, 47.91, 42.05, 40.96,
      32.04, 20.82, 1.84, 17.94, 20.91, 7.78, 14.33, 18.56, 18.57,
      35.81, 43.87, 46.93, 43.88, 43.85, 46.74, 43.94, 43.21, 43.81,
      45.6, 35.21, 45.64, 45.63, 37.94, 39.53, 35.97, 29.72, 22.55,
      20.04, 7.24, 3.43, 10.04, 14.2, 25.41, 36.98, 43.89, 50.98, 50.3,
      50.21, 45.8, 43.64, 43.49, 45.05, 49.95, 53.82, 55.94, 54.19,
      54.19, 52.98, 51.68, 48.95, 47.63, 46.48, 49.08, 47.11, 48.8,
      48.5, 49.8, 56.97, 72.6, 81.17, 81.79, 81.15, 80, 76.39, 75,
      76.06, 75.4, 76.78, 83.45, 85.15, 78.16, 71.92, 67.43, 60.49,
      54.45, 47.84, 46.58, 45.74, 43.81, 46.24, 46.46, 51.29, 60.53,
      60.02, 62.92, 61.58, 60.6, 51.89, 50.8, 45.46, 42.2, 45, 51.51,
      48.59, 49.2, 44.99, 44.93, 46.4, 43.46, 47.24, 45.88, 44.61,
      42.9, 42.03, 39.33, 42.98, 41.23, 42.12, 45.1, 44.27, 44.18,
      42.05, 38.61, 37.76, 33.03, 35.84, 44.24, 46.29, 40.05, 38.15,
      30.26, 40.2, 30.89, 23.35, 12.4, 19.01, 23.51, 23.25, 20.01,
      20.8, 22.14, 23.68, 25.05, 26.3, 30.81, 27.06, 8.5, -0.08, -0.01,
      -0.27, 21.55, 24.04, 15.91, -0.02, -0.33, 3.04, -7.28, -3.14,
      -12, -15.04, -11.09, -4.94, 1.59, 35.9, 51.22, 51.66, 46.09,
      50.26, 44.49, 41.24, 38.91, 41.79, 49.63, 50.93, 51.25, 50.93,
      50.52, 49.61, 44.3, 41.29, 37.26, 35.18, 35.82, 34.99, 34.56,
      30.8, 33.41, 47.4, 53.73, 57.02, 58.38, 56.54, 55, 53.92, 53.31,
      52.63, 52.12, 51, 53.91, 46.35, 42.73, 40.32, 39.93, 39.66, 32.04,
      29.23, 29.26, 32.64, 32.41, 33.06, 33.22, 46.63, 53.8, 55.73,
      53.83, 54.22, 54.92, 53.65, 52.69, 53.55, 53.72, 54.83, 54.01,
      52.67, 50.92, 39.81, 39.29, 39.91, 30.77, 26.35, 25.23, 22.77,
      24.02, 25.63, 28.06, 35.38, 46.04, 49.96, 50.56, 46.1, 46.02,
      43.94, 46.64, 55, 55.9, 57.43, 58.72, 55.06, 53.85, 49.52, 42.35,
      42.44, 41.11, 42.26, 40.91, 43.77, 45.05, 47.89, 49.79, 54.77,
      73.08, 76.86, 74.32, 70.51, 69.02, 68.94, 65.27, 67.44, 68.14,
      69, 75.04, 76.13, 72.46, 61.83, 59.24, 56.7, 53.16, 52.47, 53.18,
      54.73, 51.15, 52.25, 50.93, 49.04, 50.56, 55.71, 56.62, 63.13,
      57.33, 55.26, 54.38, 52.55, 55.41, 62.93, 67.15, 68.91, 57.37,
      54.61, 52.32, 51.53, 49.8, 47.74, 47.01, 48.8, 48.9, 49.63, 49.53,
      46.69, 46.76, 50.88, 52.38, 50.07, 49.33, 48.98, 47.4, 53.2,
      55.39, 58.02, 66.68, 69.43, 69.75, 67.83, 57.37, 59.56, 52.07,
      55.54, 53.02, 52.1, 51.31, 51.14, 53.23, 67.16, 79.62, 88.06,
      86.01, 80.04, 75, 70.65, 71.56, 72.03, 76.49, 81.08, 88.35, 88.5,
      79.93, 73.69, 68.34, 59.83, 54.93, 54.19, 54.05, 53.52, 51.97,
      51.96, 52.03, 62.33, 73.91, 80.23, 76.6, 74.19, 70.06, 62.07,
      58.45, 59.69, 65.09, 70.21, 78.8, 74.13, 64.46, 58.34, 55.38,
      56.59, 53.72, 53.2, 53.92, 53.11, 51.19, 51.02, 55.05, 63.96,
      82.55, 92.15, 93.65, 91.93, 88.07, 84.96, 83.99, 85.59, 86.87,
      84.96, 90.01, 93.76, 90.54, 78.49, 68.93, 65.1, 59, 61.88, 59.08,
      57.9, 56.37, 56.95, 61.53, 75.98, 99.07, 113.07, 111.23, 108.25,
      103.69, 98.33, 92.63, 89.86, 90.45, 95.01, 106.82, 121.46, 102.06,
      89.34, 74.43, 69.92, 63.79, 64.63, 60.64, 57.8, 55.44, 55.28,
      58.98, 71.1, 84.48, 97, 93.64, 85, 78, 71.81, 69.87, 68.64, 65.58,
      65.08, 70.87, 71.74, 58.51, 50.78, 51.12, 47.16, 42.9, 44.29,
      42.61, 42.51, 41.96, 41.65, 40.72, 41.53, 42.36, 51.37, 56.28,
      58.62, 59.18, 56.72, 57.44, 53.32, 52.8, 52.44, 55.95, 57.92,
      53.78, 47.98, 44.99, 43.9, 37.75, 28.42, 24.48, 19.98, 18.13,
      13.61, 15.34, 3.65, 24.47, 27.04, 32.97, 39.06, 44.05, 46.86,
      42.97, 41.18, 40.5, 41.18, 47.25, 52.64, 52.96, 50.44, 47.74,
      50.82, 44.81, 42.4, 40.97, 40.42, 37.8, 38.09, 41.83, 53.09,
      64.04, 64.88, 62.2, 58.38, 55.92, 55.12, 51.36, 48.63, 47.34,
      48.83, 60.83, 59.64, 54.37, 47.54, 45.69, 46.36, 43.91, 44.87,
      48.07, 47.49, 44.59, 45.97, 46.46, 55.82, 67.67, 72.8, 70.63,
      70.38, 67.51, 64.03, 63.84, 66.56, 66, 69.33, 71.45, 72.82, 69.81,
      59.51, 55.74, 53.83, 49.34, 46.52, 46.36, 45.1, 42.85, 42.74,
      46.34, 52.09, 64.99, 68.17, 66.76, 59.06, 53.03, 54.19, 49.7,
      53.56, 49.37, 52.65, 60.49, 62.53, 59.28, 50.02, 51.01, 50.08,
      46.86, 47.17, 45.47, 45.43, 46.82, 45.08, 48.7, 62.41, 71.7,
      78.49, 69.08, 67.35, 67.94, 66.81, 66.22, 66.16, 66.16, 65.35,
      66.68, 66.98, 65.4, 59.9, 52.84, 51.36, 46.72, 43.55, 45.47,
      43.1, 41.1, 41.51, 45.76, 47.72, 54.04, 56.66, 55.93, 55.51,
      56.9, 58.51, 64, 64.93, 64.55, 63.91, 67.71, 69.98, 67.34, 62.99,
      55.32, 54.01, 50.92, 50.04, 47.07, 45.7, 43.14, 42.71, 42.6,
      43.47, 47.68, 51.47, 55.79, 59.5, 59.15, 56.08, 50.33, 49.09,
      48.6, 49.39, 56.86, 57.91, 54.59, 50.43, 48.48, 48.49, 46.06,
      44.8, 41.29, 40.48, 39, 38.9, 38.47, 39.88, 40.97, 43.8, 47.05,
      49.33, 51.11, 50.35, 47.09, 45.14, 44.4, 45.79, 51.94, 59.54,
      57.94, 54.69, 51.94, 51.04, 46.42, 43.7, 41.37, 40.48, 39.21,
      38.55, 40.71, 49.05, 60.67, 58.93, 55.47, 48.15, 43.46, 41.69,
      40.47, 41.01, 43.37, 43.82, 49.06, 46.78, 42.08, 39.42, 38.75,
      38.52, 32.51, 34.49, 36.71, 38.42, 39.39, 39.82, 41.72, 50.31,
      61.52, 62.31, 62.31, 64.56, 62.85, 58.63, 57.81, 57.96, 58.04,
      60.35, 63.06, 65.79, 62.63, 61.77, 53.38, 50.12, 46.98, 42.8,
      41.63, 40.98, 40.4, 41.38, 42.31, 51.1, 57.59, 59.01, 53.34,
      53.54, 53.32, 53.19, 52.81, 52.93, 54.3, 56.73, 60.27, 62.4,
      59.62, 55.8, 50.49, 49.5, 46.18, 46.25, 45.21, 41.24, 38.05,
      37, 39.04, 48.06, 53.29, 53.04, 51.98, 51.47, 46.38, 43.24, 42.32,
      40.75, 41.63, 41.77, 51.37, 51.4, 45.75, 46.07, 41.47, 38.71,
      33.68, 32.73, 33.24, 32.57, 31.16, 35.71, 38.99, 45.85, 56.33,
      57.94, 54.91, 51.35, 50.66, 44.59, 39.51, 38.77, 42.31, 43.98,
      49.61, 50.66, 46.04, 35.88, 33.96, 27.56, 24.47, 0.02, 0.08,
      -4.09, -4, 0.06, 0.09, 0.05, 6.37, 12.08, 11.18, 10.64, 4.12,
      0.05, -0.1, -2.05, 0.09, 9.64, 26.97, 36.17, 25.97, 16.96, 0.09,
      12.91, 0.09, 22.88, 16.16, 16.02, 12.45, 10.19, 14.51, 7.01,
      10.98, 20.62, 32.95, 36.75, 38.68, 32.5, 34, 31.2, 27.99, 32.61,
      39.41, 49.19, 49.48, 43.1, 28.99, 34.37, 30.58, -0.01, -1.22,
      -0.04, -3.54, -3.95, 5.65, 39.91, 49.04, 49.41, 44.99, 39.94,
      38.73, 36.59, 38.54, 38.66, 38.86, 38.61
    )
)

dat <- tsibble(DAT, index = Time)

past <- dat[1:200,]
future <- anti_join(dat,past)
#> Joining, by = c("Time", "observed")

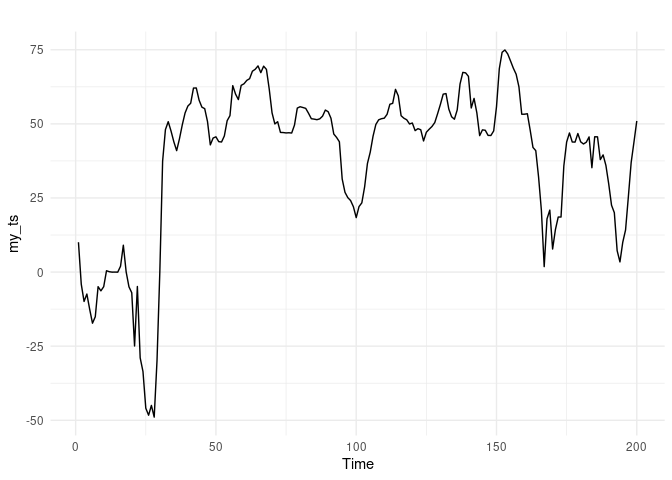
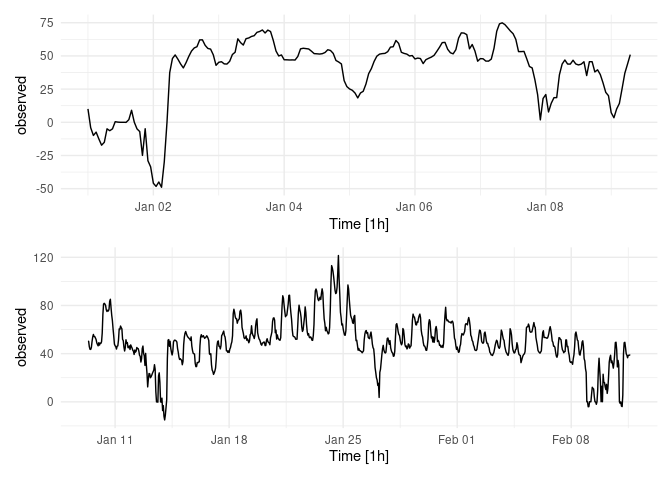
# always start with looking at the data

(autoplot(past) + theme_minimal()) / (autoplot(future) + theme_minimal())
#> Plot variable not specified, automatically selected `.vars = observed`

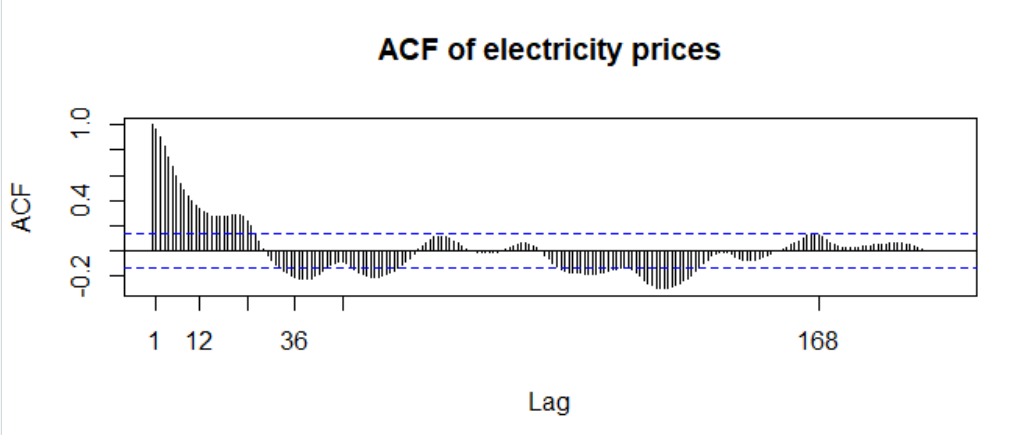
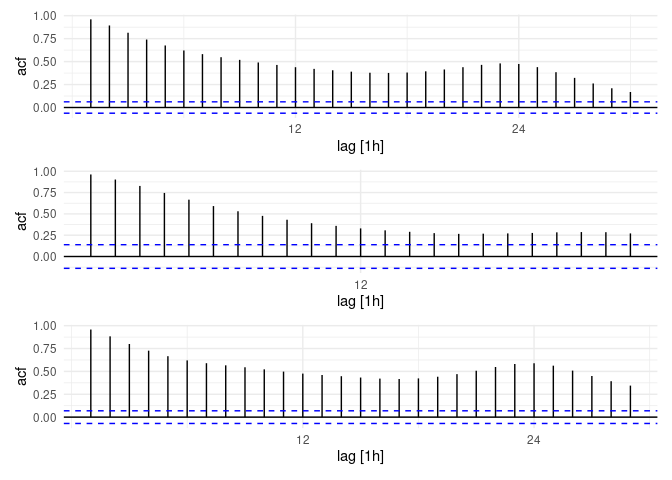
(dat %>% ACF(observed) %>% autoplot() + theme_minimal())   /
(past %>% ACF(observed) %>% autoplot() + theme_minimal())  /
(future %>% ACF(observed) %>% autoplot() + theme_minimal())
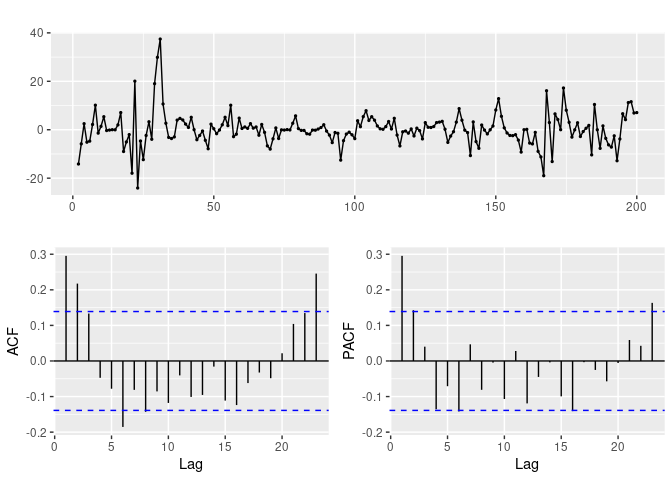
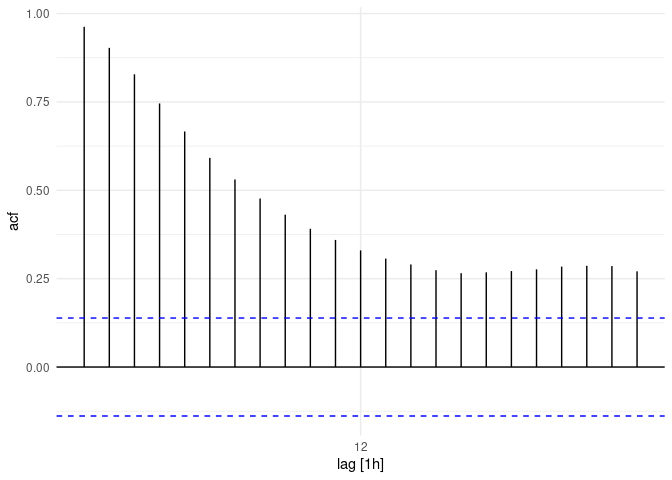
past %>%
  mutate(diffed = difference(observed)) %>%
  ACF() %>%
  autoplot() + theme_minimal()
#> Response variable not specified, automatically selected `var = observed`

past %>%
  mutate(diffed = difference(observed)) %>%
  PACF() %>%
  autoplot() + theme_minimal()
#> Response variable not specified, automatically selected `var = observed`

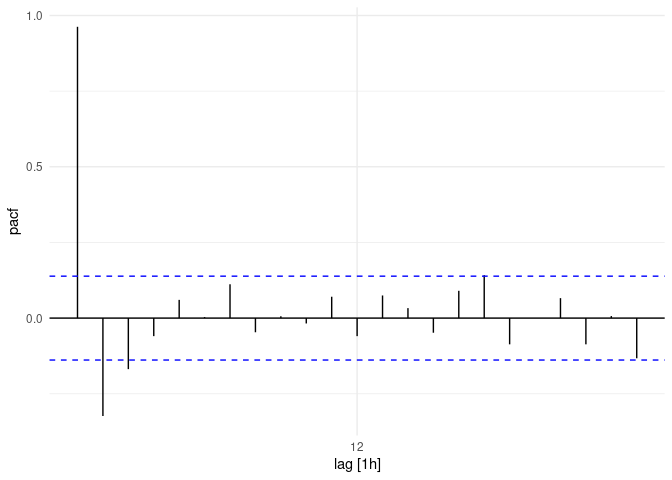
# ACF is sinusoidally declining and PACF has no peak after lag 1 suggests ARIMA(p,d,0) = 1,1,0
# 
#Calculate auto ARIMA  based on the first 200 entries (hours)

fit <- past %>%
  model(auto = ARIMA(observed))

# unitroot test for stationarity

past %>%
  features(observed, unitroot_kpss)
#> # A tibble: 1 x 2
#>   kpss_stat kpss_pvalue
#>       <dbl>       <dbl>
#> 1     0.884        0.01

# test differenced 

fit <- past %>%
  model(auto = ARIMA(difference(observed)))
#> Error: No supported inverse for the `difference` transformation.

fit %>% report()
#> Series: observed 
#> Model: ARIMA(1,1,1)(2,0,0)[24] 
#> 
#> Coefficients:
#>           ar1     ma1    sar1    sar2
#>       -0.8038  0.9197  0.1483  0.2914
#> s.e.   0.1112  0.0763  0.0750  0.1046
#> 
#> sigma^2 estimated as 41.4:  log likelihood=-653.57
#> AIC=1317.15   AICc=1317.46   BIC=1333.62

past %>%
  mutate(diffed = difference(observed)) %>%
  features(diffed, unitroot_kpss)
#> # A tibble: 1 x 2
#>   kpss_stat kpss_pvalue
#>       <dbl>       <dbl>
#> 1    0.0401         0.1

# confirmation

past %>%
  features(observed, unitroot_ndiffs)
#> # A tibble: 1 x 1
#>   ndiffs
#>    <int>
#> 1      1

# Portmanteau confirmation

augment(fit) %>%
  features(.innov, ljung_box, dof = 1, lag = 12)
#> # A tibble: 1 x 3
#>   .model lb_stat lb_pvalue
#>   <chr>    <dbl>     <dbl>
#> 1 auto      19.6    0.0515

# no seasonal differencing

past %>% features(observed, unitroot_nsdiffs)
#> # A tibble: 1 x 1
#>   nsdiffs
#>     <int>
#> 1       0

# near zero mean, fit is not biased

mean(augment(fit)$.resid)
#> [1] 0.09024311

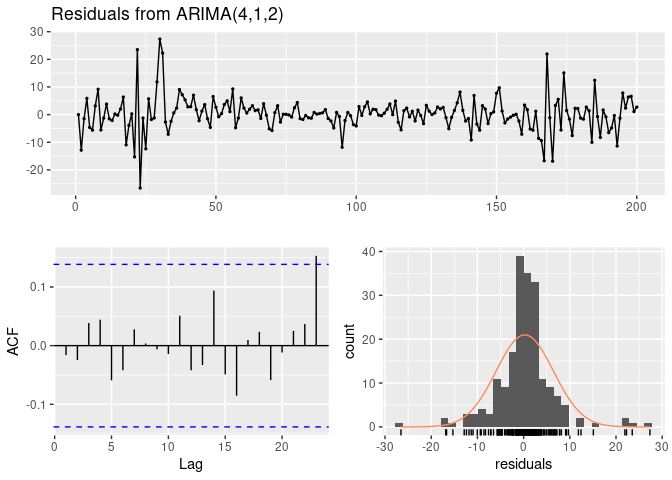
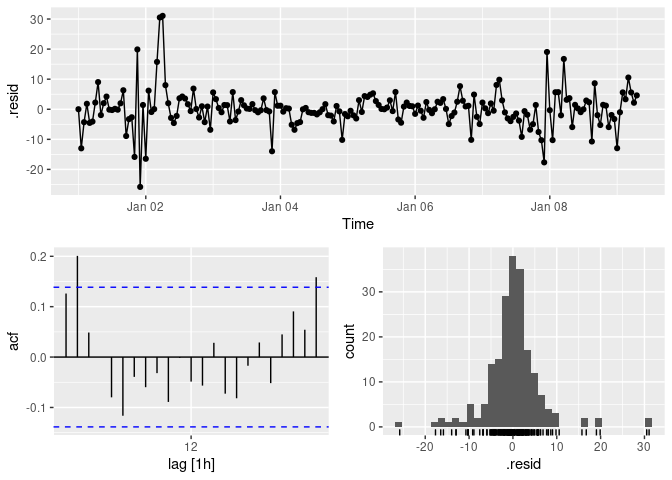
# lags at 2 and 23, approx normally distributed residuals

fit %>% gg_tsresiduals()

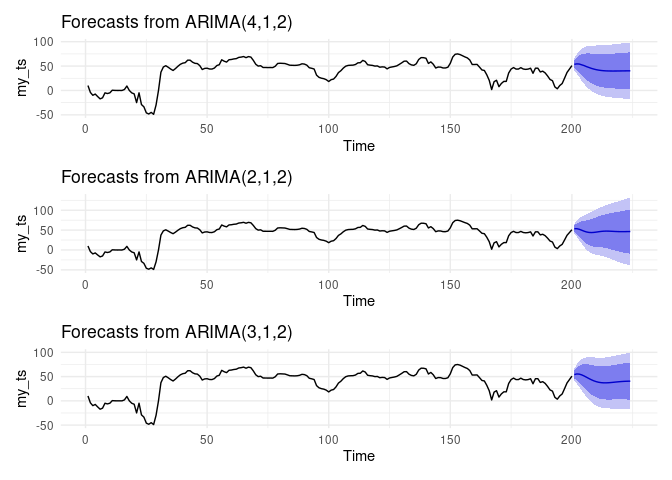
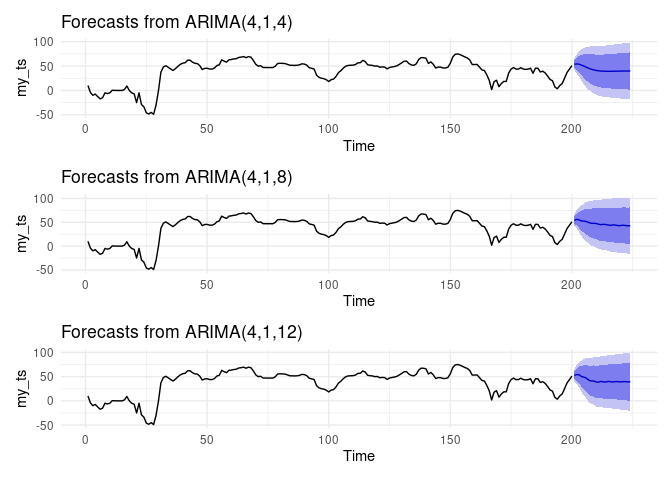
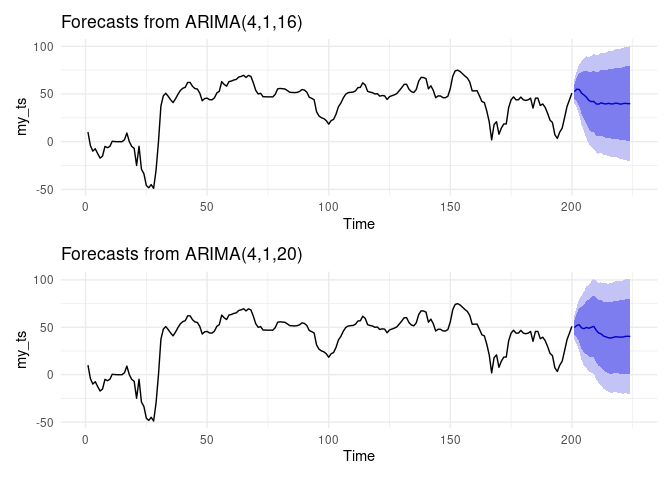
fc <- fit %>% forecast(new_data = future) 
autoplot(fc) + theme_minimal()
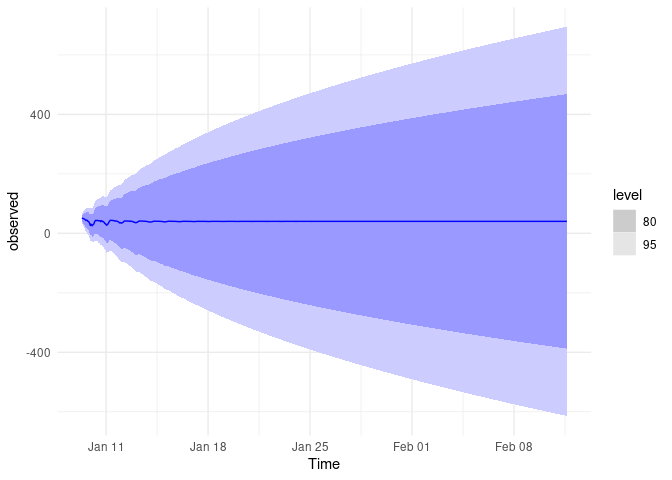
accuracy(fc,future)
#> # A tibble: 1 x 10
#>   .model .type    ME  RMSE   MAE   MPE  MAPE  MASE RMSSE  ACF1
#>   <chr>  <chr> <dbl> <dbl> <dbl> <dbl> <dbl> <dbl> <dbl> <dbl>
#> 1 auto   Test   9.47  21.4  16.5  738. 2416.   NaN   NaN 0.958

# fit2 <- past %>%
#   model(ar3120 = ARIMA(observed ~ 0 + pdq(3,1,20))) %>%
#   report()
1 Like

Thanks technocrat for your answer and effort. I really appreciate it. Basically I still do not know what you mean by "Can you specify the commented out fit2 at the bottom and post back the reprex ?" In the post above I posted all of my code that I used. I did not comment out anything.
Furhter I do not understand how you generated the future values with the command

future <- anti_join(dat,past)

Is this a function similar to the 'forecast' function of the library forecast? I also do not understand what you do with all these comments like

past %>%
  features(observed, unitroot_kpss)

I also do not understand why you are plotting 3 ACF functions and why you "mutate
(diffed = difference(observed))" them? Anyways, also in all of your ACF plots there are positive values for high lags which would mean that the order of the MA model should be quite high (above 10). However, the autoarima leads to an ARIMA (4,1,2) model. As said before, the strange thing is that when I increas the MA order, the AIC gets worse. I still could not figure out, why this is the case.

)
Forecasting: Principles and Practices has a checklist. It's applied to your data in the reprex below.

  • Plot the data and identify any unusual observations.
  • If necessary, transform the data (using a Box-Cox transformation) to stabilise the variance.
  • If the data are non-stationary, take first differences of the data until the data are stationary.
  • Examine the ACF/PACF: Is an ARIMA(p,d,0) or ARIMA(0,d,q* ) model appropriate?
  • Try your chosen model(s), and use the AICc to search for a better model.
  • Check the residuals from your chosen model by plotting the ACF of the residuals, and doing a portmanteau test of the residuals. If they do not look like white noise, try a modified model.
  • Once the residuals look like white noise, calculate forecasts.

For the price series, the ARIMA(4,1,2) non-seasonal model has the best AICc score and its diagnostics are satisfactory. Running the model with seasonal terms didn't improve things.

No model can forecast very well if the data don't show enough regularity. In an ARIMA model we depend on the past values of a single variable and it's natural to expect that the influence of past values becomes attenuated as the forecast horizon increases. That's a reason that the prediction intervals widen.

Check the additional methods described in the text, such as dynamic regression if there are other variables that may help explain variability. One example is weather for electricity demand.

suppressPackageStartupMessages({
  library(fpp2)
  library(patchwork)
})

price <- c(10.07, -4.08, -9.91, -7.41, -12.55, -17.25, -15.07, -4.93, -6.33, -4.93, 0.45,
  0.12, -0.02, 0, -0.03, 1.97, 9.06, 0.07, -4.97, -6.98, -24.93, -4.87,
  -28.93, -33.57, -45.92, -48.29, -44.99, -48.93, -29.91, -0.01, 37.43, 48.06, 
  50.74, 47.57, 43.94, 40.97, 44.95, 49.64, 53.67, 56.01, 56.95, 62.08, 62.11,
  57.99, 55.64, 55.13, 50.76, 42.91, 45.22, 45.63, 44, 43.88, 45.92, 51.07, 52.77, 
  62.89, 60.03, 58.19, 62.99, 63.52, 64.67, 65.24, 67.76, 68.41, 69.55, 67.28,
  69.46, 68.38, 61.72, 53.72, 49.98, 50.73, 47.11, 47.07, 46.94, 47, 46.91,
  49.59, 55.32, 55.78, 55.52, 55.23, 53.58, 51.74, 51.6, 51.41, 51.69, 52.59,
  54.66, 54.1, 51.89, 46.58, 45.43, 43.96, 31.41, 26.9, 25.12, 24.12, 22.04,
  18.37, 22.09, 23.35, 28.76, 36.63, 40.46, 45.85, 49.8, 51.36, 51.74, 51.92,
  53.22, 56.62, 56.92, 61.64, 59.44, 52.75, 51.9, 51.38, 49.96, 50.29, 47.72,
  48.38, 48.02, 44.23, 47.17, 48.19, 49.11, 50.44, 53.4, 56.55, 60.02, 60.22, 
  55, 52.39, 51.57, 54.71, 63.43, 67.37, 67.2, 66.03, 55.36, 58.59, 53.7, 46.03,
  47.98, 47.84, 46.11, 46.08, 47.62, 55.77, 68.61, 74.15, 74.93, 73.59, 71.23,
  68.79, 66.75, 62.47, 53.25, 53.26, 53.42, 47.91, 42.05, 40.96, 32.04, 20.82,
  1.84, 17.94, 20.91, 7.78, 14.33, 18.56, 18.57, 35.81, 43.87, 46.93, 43.88,
  43.85, 46.74, 43.94, 43.21, 43.81, 45.6, 35.21, 45.64, 45.63, 37.94, 39.53,
  35.97, 29.72, 22.55, 20.04, 7.24, 3.43, 10.04, 14.2, 25.41, 36.98, 43.89, 50.98
)

# Convert to time series

my_ts <- ts(price)

# Visualize

autoplot(my_ts) + theme_minimal()

# Is the time series stationary?

ndiffs(my_ts)
#> [1] 1

# No it requires one differencing, so the d term of ARIMA(p,d,q)
# will always be 1

# Box-Cox transformation) is not needed to to stabilise the variance.

(lambda <- BoxCox.lambda(my_ts))
#> [1] 1.532525
(autoplot(BoxCox(my_ts, lambda)) + theme_minimal()) / (autoplot(my_ts) + theme_minimal())

# ACF plot suggests q = 2 and PACF suggests p = 4

my_ts %>%
  diff() %>%
  ggtsdisplay()

# Calculate non-seasonal ARIMA model using p = 4, d = 1, q = 2

(baseline <- Arima(my_ts, order = c(4, 1, 2)))
#> Series: my_ts 
#> ARIMA(4,1,2) 
#> 
#> Coefficients:
#>          ar1     ar2      ar3      ar4      ma1      ma2
#>       0.2929  0.9292  -0.1550  -0.2718  -0.0439  -0.8273
#> s.e.  0.1136  0.1245   0.0793   0.0718   0.1019   0.1033
#> 
#> sigma^2 estimated as 39.85:  log likelihood=-646.36
#> AIC=1306.71   AICc=1307.3   BIC=1329.76

# Compared to auto.arima is identical

(automatic <- auto.arima(my_ts))
#> Series: my_ts 
#> ARIMA(4,1,2) 
#> 
#> Coefficients:
#>          ar1     ar2      ar3      ar4      ma1      ma2
#>       0.2929  0.9292  -0.1550  -0.2718  -0.0439  -0.8273
#> s.e.  0.1136  0.1245   0.0793   0.0718   0.1019   0.1033
#> 
#> sigma^2 estimated as 39.85:  log likelihood=-646.36
#> AIC=1306.71   AICc=1307.3   BIC=1329.76

# score using AICs

baseline$aicc
#> [1] 1307.297

# consider alternative models

# auto.arima already takes care of
# ARIMA(0,1,0) ARIMA(2,1,2) ARIMA(1,1,0) ARIMA(0,1,1)
# plus varying p and q by +/-

# consider p = 2 and 3 while holding q at 2; AICc slightly worse

arima2_2 <- Arima(my_ts, order = c(2, 1, 2))
arima2_2$aicc
#> [1] 1311.893
arima3_2 <- Arima(my_ts, order = c(3, 1, 2))
arima3_2$aicc
#> [1] 1310.075

# hold p =4 and increase q

arima4_4 <- Arima(my_ts, order = c(4, 1, 4))
arima4_4$aicc
#> [1] 1310.964
arima4_8 <- Arima(my_ts, order = c(4, 1, 8))
arima4_8$aicc
#> [1] 1315.771
arima4_12 <- Arima(my_ts, order = c(4, 1, 12))
arima4_12$aicc
#> [1] 1319.187
arima4_16 <- Arima(my_ts, order = c(4, 1, 16))
arima4_16$aicc
#> [1] 1324.119
arima4_20 <- Arima(my_ts, order = c(4, 1, 20))
arima4_20$aicc
#> [1] 1335.132

# prediction intervals over the forecast horizon quickly
# grow to encompass entire range of previous data

(baseline %>% forecast(h = 24) %>% autoplot() + theme_minimal()) / (arima2_2 %>% forecast(h = 24) %>% autoplot() + theme_minimal()) / (arima3_2 %>% forecast(h = 24) %>% autoplot() + theme_minimal())

(arima4_4 %>% forecast(h = 24) %>% autoplot() + theme_minimal()) / (arima4_8 %>% forecast(h = 24) %>% autoplot() + theme_minimal()) / (arima4_12 %>% forecast(h = 24) %>% autoplot() + theme_minimal())

(arima4_16 %>% forecast(h = 24) %>% autoplot() + theme_minimal()) / (arima4_20 %>% forecast(h = 24) %>% autoplot() + theme_minimal())

# Residuals diagnostics
# variance appears fairly consistent
# residuals are approximately normal
# only correlated at lag 23

checkresiduals(baseline)

#> 
#>  Ljung-Box test
#> 
#> data:  Residuals from ARIMA(4,1,2)
#> Q* = 2.1935, df = 4, p-value = 0.7002
#> 
#> Model df: 6.   Total lags used: 10

# mean of residuals is zero for ARIMA(4,1,2)

mean(residuals(baseline))
#> [1] 0.2531493

# Box-Ljung test indicates that series are not distinguishable from
# white noise

Box.test(residuals(baseline), lag = 23, fitdf = 0, type = "Lj")
#> 
#>  Box-Ljung test
#> 
#> data:  residuals(baseline)
#> X-squared = 14.139, df = 23, p-value = 0.9228

# prediction intervals over the forecast horizon quickly
# grow to encompass entire range of previous data

(baseline %>% forecast(h = 24) %>% autoplot() + theme_minimal()) / (arima2_2 %>% forecast(h = 24) %>% autoplot() + theme_minimal()) / (arima3_2 %>% forecast(h = 24) %>% autoplot() + theme_minimal())

(arima4_4 %>% forecast(h = 24) %>% autoplot() + theme_minimal()) / (arima4_8 %>% forecast(h = 24) %>% autoplot() + theme_minimal()) / (arima4_12 %>% forecast(h = 24) %>% autoplot() + theme_minimal())

(arima4_16 %>% forecast(h = 24) %>% autoplot() + theme_minimal()) / (arima4_20 %>% forecast(h = 24) %>% autoplot() + theme_minimal())

# consider adding a seasonal component

arima_seasonal <- Arima(my_ts, order = c(4, 1, 2), seasonal = c(0, 1, 14))

# same AICc

arima_seasonal$aicc
#> [1] 1307.297

(baseline %>% forecast(h = 24) %>% autoplot() + theme_minimal()) / (arima_seasonal %>% forecast(h = 24) %>% autoplot() + theme_minimal())

1 Like

Thanks technocrat for your answer and effort, I really appreciate it,

the problem is that the ACF has high positive values until the lag of 20 or something. Increasing the MA order however leads to worse AIC values. So then I think it is wrong to say that the order of the MA depends on the ACF. At least in my case this is definitely not the case.

See Hyndman

The data may follow an ARIMA(p,d,0) model if the ACF and PACF plots of the differenced data show the following patterns:

the ACF is exponentially decaying or sinusoidal; there is a significant spike at lag p in the PACF, but none beyond lag p

The data may follow an ARIMA(0,d,q) model if the ACF and PACF plots of the differenced data show the following patterns:

the PACF is exponentially decaying or sinusoidal; there is a significant spike at lag q in the ACF, but none beyond lag q.

1 Like

Thanks technocrat for your answer and the link,

there it is written "If p and q are both positive, then the plots do not help in finding suitable values of p and q."
So this means if the autoarima models yields positive p and q (as in my case), the ACF and PACF plots can be neglected. So it was my misunderstanding as I thought that the ACF and PACF plots always yield valuable information.

But generally I want to thank you for your tremendous help and effort. I really appreciate it.

This topic was automatically closed 7 days after the last reply. New replies are no longer allowed.

If you have a query related to it or one of the replies, start a new topic and refer back with a link.