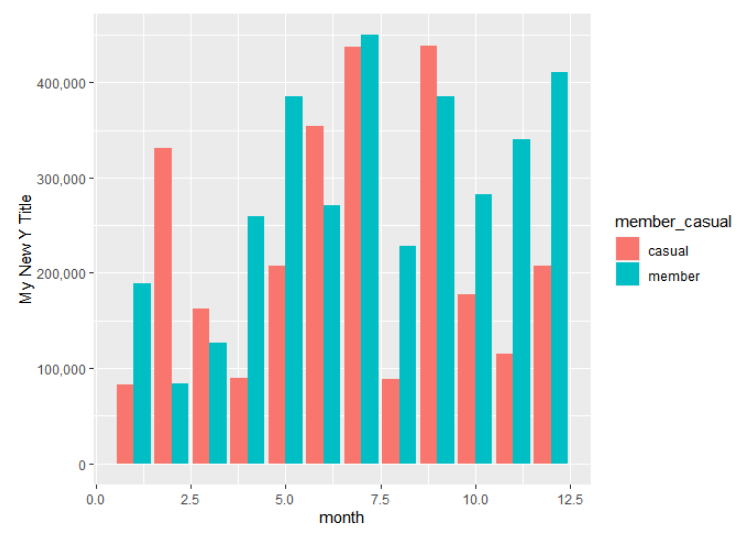
Assuming this was made with ggplot2, you can add a line for labs() to alter the y-axis title and scale_y_continuous() to alter the y-axis labels. Example below.
library(tidyverse)
set.seed(100)

df = data.frame(
  month = c(1:12, 1:12),
  number_of_rides = c(sample(0:500000, 12), sample(0:500000,12)),
  member_casual = c(rep('casual', 12), rep('member', 12))
)

ggplot(df, aes(x = month, y = number_of_rides, fill = member_casual)) +
  geom_bar(stat = 'identity', position = 'dodge') +
  labs(y = 'My New Y Title') +
  scale_y_continuous(labels = scales::comma)
Created on 2023-01-09 with reprex v2.0.2.9000
1 Like
This topic was automatically closed 42 days after the last reply. New replies are no longer allowed.
If you have a query related to it or one of the replies, start a new topic and refer back with a link.