Lilip
August 12, 2022, 5:57pm
1
I tried this stacked barplot, using the starwars df as an example. I got the skin color frequencies from the two filtered species. What I want is to add one more bar with the total skin color frequencies for both human and droid. Any suggestion?
myplot <- starwars %>%
  count(species, skin_color) %>%
  group_by(species) %>%
  filter(species=="Human" | species== "Droid") %>%
  mutate(pct= prop.table(n) * 100) %>%
  ggplot() + aes(y= species, pct, fill=skin_color) +
  geom_bar(stat="identity") +
  ylab("Species") +
  geom_text(aes(label=paste0(sprintf("%1.1f", pct),"%")),
            position=position_stack(vjust=0.5)) +
  ggtitle("Distribution of skin_color") +
  theme_bw()
Lilip
August 13, 2022, 5:16pm
2
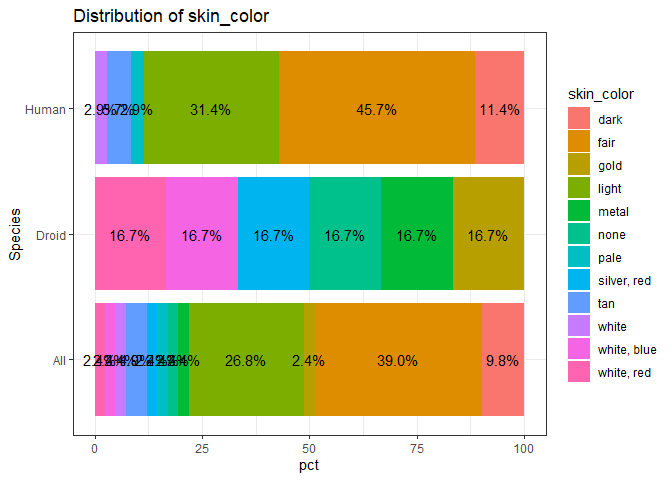
Actually, I meant one more bar with the total frequencies for skin_color, regardless the species.
FJCC
August 13, 2022, 5:59pm
3
Does this get you what you want despite the messy plot?
library(tidyverse)
#> Warning: package 'tibble' was built under R version 4.1.2
BySpecies <- starwars %>%
  count(species, skin_color) %>%
  group_by(species) %>%
  filter(species=="Human" | species== "Droid") %>%
  mutate(pct= prop.table(n) * 100)

AllSpecies <- starwars %>%
  filter(species=="Human" | species== "Droid") %>%
  count(skin_color) %>%
  mutate(pct= prop.table(n) * 100,
         species="All")

rbind(BySpecies,AllSpecies) |>
  ggplot() + aes(y= species, pct, fill=skin_color) +
  geom_bar(stat="identity") +
  ylab("Species") +
  geom_text(aes(label=paste0(sprintf("%1.1f", pct),"%")),
            position=position_stack(vjust=0.5)) +
  ggtitle("Distribution of skin_color") +
  theme_bw()
Created on 2022-08-13 by the reprex package (v2.0.1)
Lilip
August 15, 2022, 11:35am
4
Yes, it does. hadn´t had the ideia of rbind!! It won´t get messy as the real data has few values. Thanks.
system
September 5, 2022, 11:35am
5
This topic was automatically closed 21 days after the last reply. New replies are no longer allowed.