I'm teaching myself this stuff and I'm having an issue when I try to use geom_hex to make a heat chart. While I can make a chart that makes sense with 2DBin charts, the second I try to make the exact same chart with the exact same data using geom_hex it goes crazy when it tries to write the chart.
Is it a compatibility issue?
Here's my code, thanks.
library(ggplot2)
#> Warning: package 'ggplot2' was built under R version 4.2.2
library(ggplot2movies)
library(hexbin)
#> Warning: package 'hexbin' was built under R version 4.2.2

pl <- ggplot(movies, aes(x = year, y = rating))
#Now I make it a 2DBox
p2 <- pl+geom_bin2d()
print(p2 + scale_fill_gradient(high = '#0DE8EF', low = '#373C3D'))
##Output comes out fine.
#Try the same with hexbin
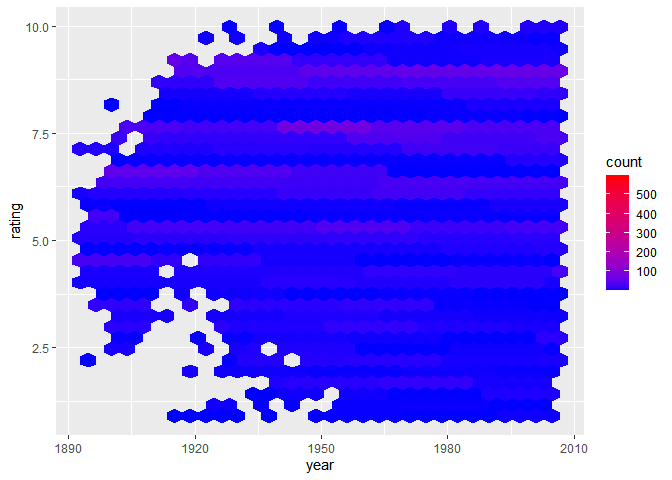
p2 <- pl + geom_hex()
print(p2 + scale_fill_gradient(high = 'red', low = 'blue' ))
##Output comes out looking wonky as heck with a median that is indistinguishable,
## No distinguishable heat points. I tried to do the same think with another variable.

pl <- ggplot(movies, aes(x = year, y = votes))
print(pl+geom_bin2d())
print(pl+geom_hex())
##Something isn't acting right for me.

summary(select(movies,year,votes))
#> Error in h(simpleError(msg, call)): error in evaluating the argument 'object' in selecting a method for function 'summary': could not find function "select"
Rating wasn't discreet. That's one thing that was confusing me. I can plot it just fine using one visualization (geom_bin2d), but under another, in the 'hexbit' package, it won't plot. I didn't know if it was a compatibility issue?
I am confused, which is not entirely unusual. Both geom_bin2d() and geom_hex() are from the {ggplot2} package, not the {hexbin} package. Do you have additional code using functions from the latter?
I used the ggplot2movies dataset which is included in the libraries I included with my code. Once you call the movies dataframe it should reproduce the result...
Turns out though that it is a problem with the geom_hex function/ ggplot2 and not with hexbit.
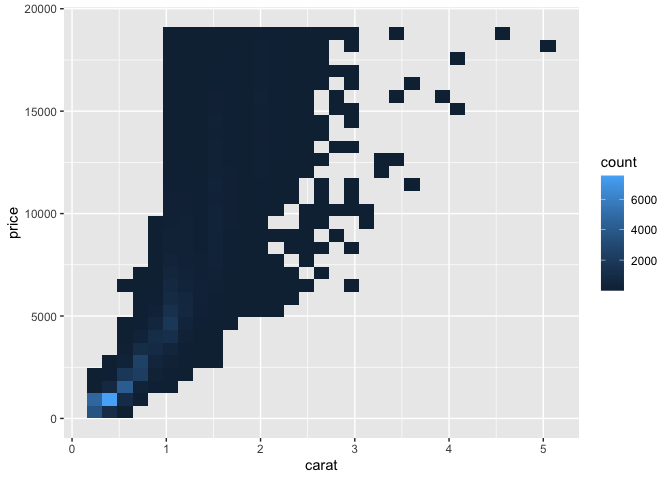
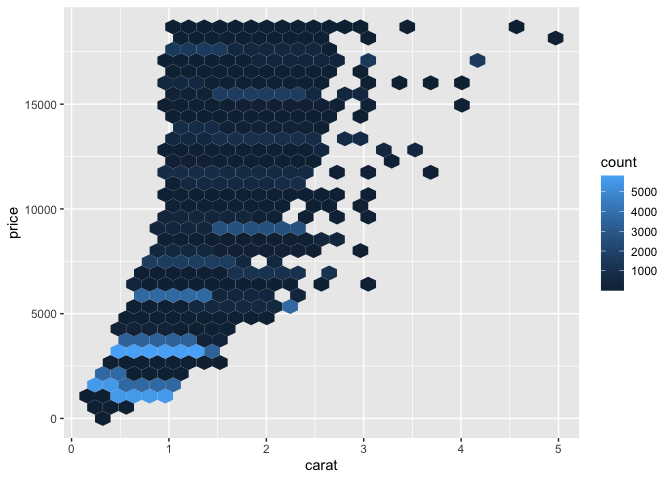
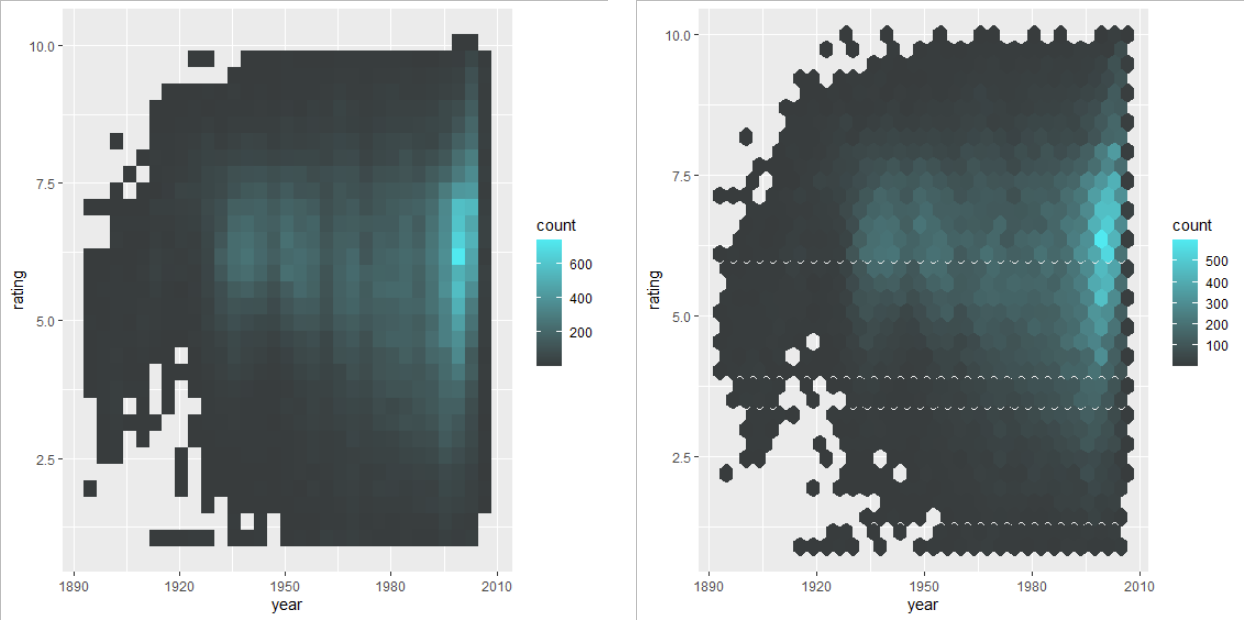
This is interesting, clearly these 2 aren't the same, in geom_hex the density seems to be calculated row-wise (along the x-axis) in geom_2d, column-wise (along the y-axis).
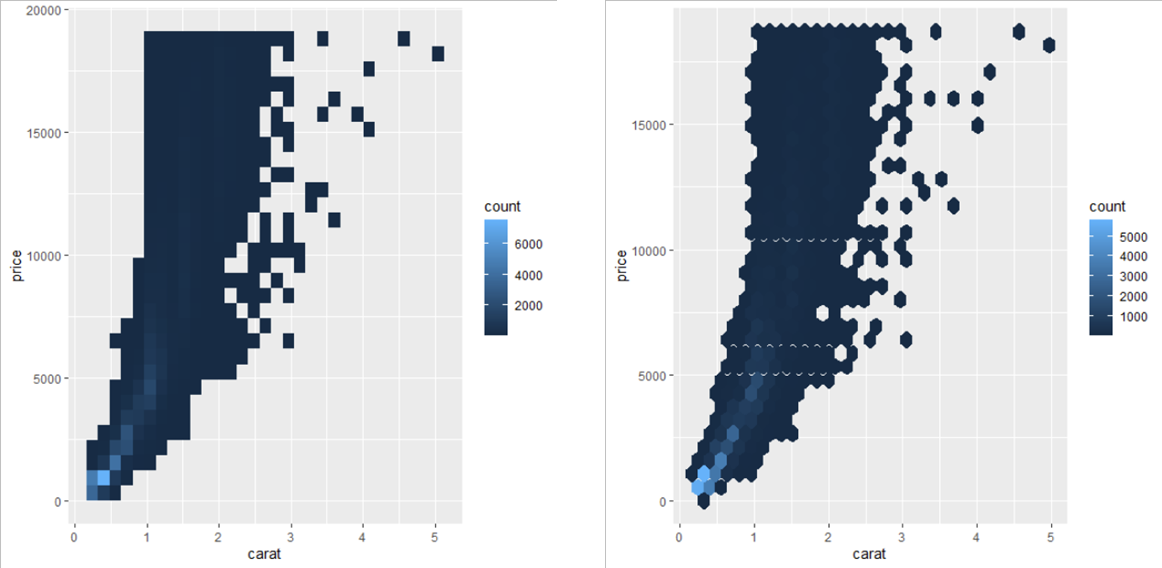
On my computer (with ggplot2 version 3.3.6) it looks more similar:
Thank you all so much for taking the time to help. Sounds like there's an interim bandage discussed in issue #5044 for ggplot2 on github? I'm really not familiar with adding commits / git files at this point so I'm not sure I want to bother with that... Especially seeing now that if I actually use the syntax for hexbin I can make a workaround.
I'll just make a note to periodically check for an update I suppose... add into my notes where I can find the link for the commit / git syntax if I need to make a workaround for some reason..
Again , thank you so much... Matthias, EconProf, technocrat, much obliged.