I have a large data set large where one of the columns of data contains whole numbers and a goodly number of NAs. How do I create a histogram and ignore the NAs?
NA NA 79 63 60 NA 63 NA 58 NA 57 56 63 50 NA NA NA 60 52 NA NA 57 ...
Thanks,
Jeff
I have a large data set large where one of the columns of data contains whole numbers and a goodly number of NAs. How do I create a histogram and ignore the NAs?
NA NA 79 63 60 NA 63 NA 58 NA 57 56 63 50 NA NA NA 60 52 NA NA 57 ...
Thanks,
Jeff
Add na.rm = TRUE to the geom arguments
Hi @JeffF,
In histograms the NAs are ignored by default.
The ggplot() output includes a warning.
x <- c(NA, NA, 79, 63, 60, NA, 63, NA, 58, NA, 57,
56, 63, 50, NA, NA, NA, 60, 52, NA, NA, 5)
length(x)
#> [1] 22
length(x[!is.na(x)])
#> [1] 12
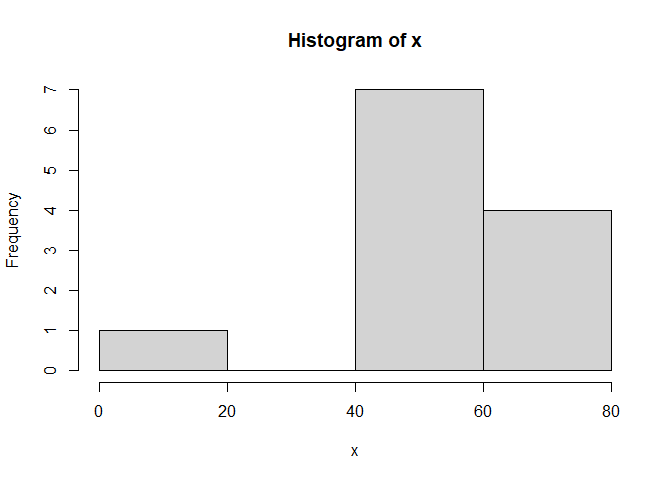
# NAs are excluded by default
hist(x)
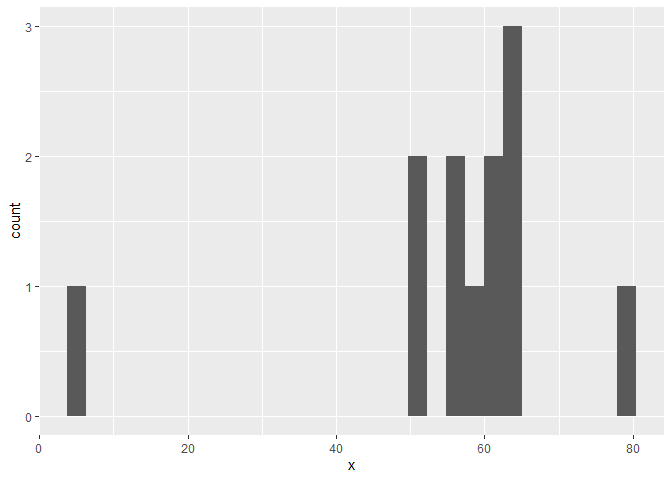
library(ggplot2)
ggplot() + geom_histogram(aes(x))
#> `stat_bin()` using `bins = 30`. Pick better value with `binwidth`.
#> Warning: Removed 10 rows containing non-finite values (`stat_bin()`).
Created on 2023-01-03 with reprex v2.0.2
This topic was automatically closed 7 days after the last reply. New replies are no longer allowed.
If you have a query related to it or one of the replies, start a new topic and refer back with a link.