geom_line not generating right plot in shiny.

library(ggplot2)
library(shiny)
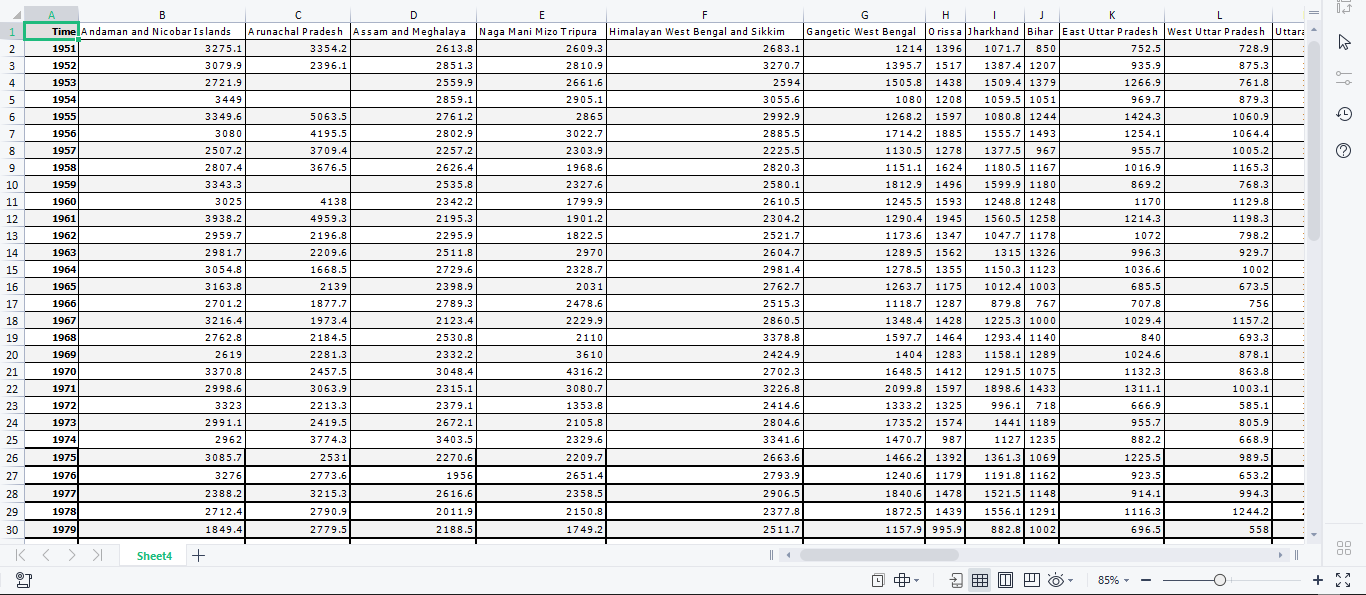
file<- read.csv("csvrainfall.csv")
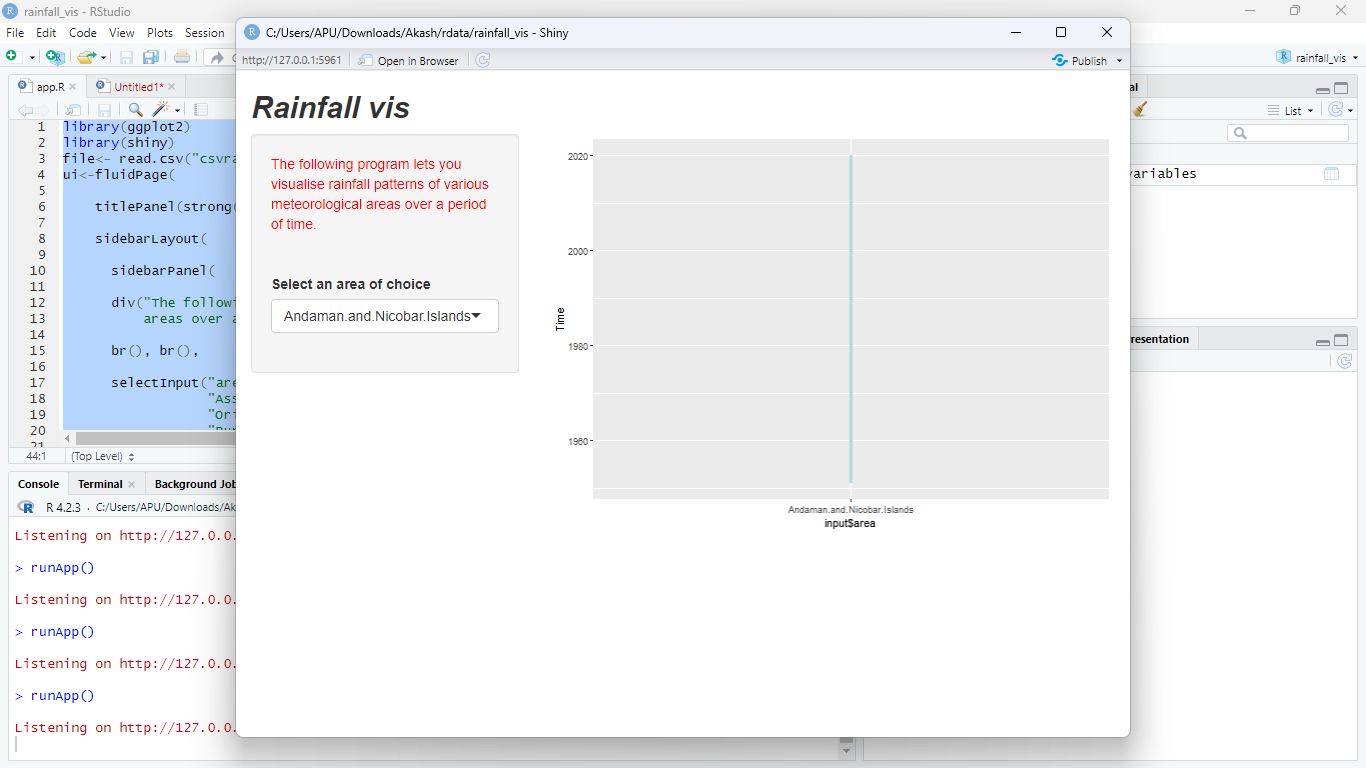
ui<-fluidPage(

titlePanel(strong(em("Rainfall vis"))),

sidebarLayout(

  sidebarPanel(
  
  div("The following program lets you visualise rainfall patterns of various meteorological 
      areas over a period of time. ", style= "color:red"),
  
  br(), br(),
  
  selectInput("area","Select an area of choice", choices = c("	Andaman.and.Nicobar.Islands"	,"Arunachal.Pradesh"	,
              "Assam.and.Meghalaya",	"Naga.Mani.Mizo.Tripura",	"Himalayan.West.Bengal.and.Sikkim",	"Gangetic.West.Bengal",	
              "Orissa",	"Jharkhand",	"Bihar",	"East.Uttar.Pradesh",	"West.Uttar.Pradesh",	"Uttarakhand",	"Haryana.Delhi.and.Chandigarh",
              "Punjab",	"Himachal.Pradesh",	"Jammu.and.Kashmir",	"West.Rajasthan",	"East.Rajasthan",	"West.Madhya.Pradesh",
              "East.Madhya.Pradesh",	"Gujarat.Region",	"Saurashtra.and.Kutch",	"Konkan.and.Goa",	"Madhya.Maharashtra",	
              "Marathwada",	"Vidarbha",	"Chhattisgarh","Coastal.Andhra.Pradesh",	"Telangana",	"Rayalseema",	"Tamil.Nadu",
              "Coastal.Karnataka",	"North.Interior.Karnataka",	"South.Interior.Karnataka",	"Kerala",	"Lakshadweep"
  ), selected = "Andaman.and.Nicobar.Islands"),


  ),     #sidebarpanel
  
  mainPanel(plotOutput("timeseries"))

)  #sidebarlayout

) #ui

server<-function(input, output){

output$timeseries<- renderPlot({
ggplot(data= file aes(x=input$area, y=Time) )+ geom_line(, aes(x=input$area, y=Time )
})
}

shinyApp(ui=ui, server=server)

#plotimage

I'm assuming, from your code, that the dataset in question contains rainfall values over time for various different regions, and based on your select input, you want to plot one region's rainfall at a time.

If this is the case, you'll want to filter the dataset for the region specified and then plot it. Setting the x variable to the region simply treats that axis as categorical, hence the single value on that axis. Below is an example of how this filtering may work in practice.

ggplot(data=filter(file, Area==input$area), aes(x=Time, y=Rainfall)) +
     geom_line()

I'm not sure what the variables are named in the dataset, but just substitute the area variable for 'Area' and the rainfall variable for 'Rainfall' in the above code and it should generate no problem.

Hope this helps!

Thank you for the response, but there is a problem. There is no rainfall variable as such, rainfall observations are plotted under each area as column head.
Here is a screenshot of the data file.

Sorry for the late response on this. The data would just need to be pivoted in order to get it into a form where my earlier solution would work. Try the following code:

file <- file %>%
    pivot_longer(cols=-c(Time),names_to="Area",values_to="Rainfall")

This will put it into the proper form for plotting.

Hope this helps!

This topic was automatically closed 54 days after the last reply. New replies are no longer allowed.

If you have a query related to it or one of the replies, start a new topic and refer back with a link.