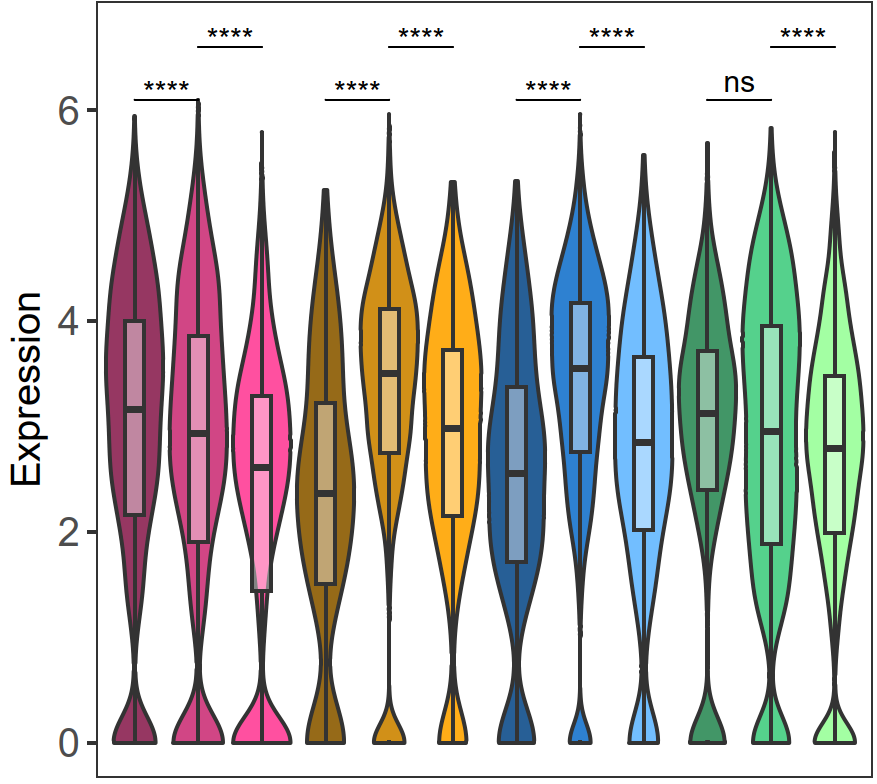
Hi, I would like to increase the space between every 3 violins in my plot, so I can visually divide my sample into 4 groups. I tried different ways but was not successful, can you please help me with that?
Here is my code to generate this plot but now I want the violins with almost the same color to arrange close to each other and have space with the others:
gene <- c("CD183.Ab", "CD45RA:HI100.Ab", "CD279:EH12-1.Ab", "CD134:ACT35.Ab", "CD137.Ab", "HLA-DR.Ab", "CD278.Ab", "CD62L:DREG-56.Ab","GITR.Ab", "CD27:M-T271.Ab", "CD28:L293.Ab", "CCR7.Ab", "CXCR6.Ab", "CD279.Ab", "Tim3.Ab")

DefaultAssay(cart.combined) <- "RNA"

Idents(cart.combined) <- "CARtag"
compare <- list(
                      c("CD3_LV.CAR-His-", "CD3_LV.CAR-His+"),
                      c("CD3_LV.CAR-His+", "CD3_LV.CAR+His"),
                      c("CD4_LV.CAR-His-", "CD4_LV.CAR-His+"),
                      c("CD4_LV.CAR-His+", "CD4_LV.CAR+His"),
                      c("CD8_LV.CAR-His-", "CD8_LV.CAR-His+"),
                      c("CD8_LV.CAR-His+","CD8_LV.CAR+His"),
                      c("VSV_LV.CAR-VSV-", "VSV_LV.CAR-VSV+"),
                      c("VSV_LV.CAR-VSV+", "VSV_LV.CAR+VSV"))

vln_df <- list()
plot_list_vln_df <- list()
pwc <- list()
p.val.size <- 3
plot.title.size <- 13
set.seed(42)
# change number according to total groups plotted
mycolors <- c("#8B2252", "#CD3278", "#FF3E96", "#8B5A00", "#CD8500", "#FFA500", "#104E8B", "#1874CD", "#63B8FF", "#2E8B57", "#43CD80", "#9AFF9A")

for(i in gene){

#  violin plot without noise. change object
vln_df[[i]] = data.frame(Expression=cart.combined[["RNA"]]@data[i,], Subset = cart.combined$CARtag)

# Statistics
pwc[[i]] <- vln_df[[i]] %>%
  wilcox_test(Expression ~ Subset, p.adjust.method = "none", comparisons = compare)
pwc[[i]] <- pwc[[i]] %>% add_xy_position(x = "Subset")
pwc[[i]]$FDR <- p.adjust(pwc[[i]]$p, method = "BH")#, n=length(gene))
pwc[[i]] <- add_significance(pwc[[i]], p.col = "FDR", output.col = "FDR.signif")


# Graphs
# Add noise for optimal visualization purposes like VlnPlot()
noise <- rnorm(n = length(x = vln_df[[i]][, "Expression"])) / 100000
vln_df[[i]]$Expression <- vln_df[[i]]$Expression + noise

# Variable stats position.
### OBS! MIGHT NEED TO BE ADJUSTED for the height of the p-value symbols and lines!!###
y.position <- seq(max(vln_df[[i]]$Expression), max(vln_df[[i]]$Expression) + 0.5, by = 0.5)

# Variable ylim range
ylim <- ylim(0, max(y.position) + 0.1)


# violin plot with noise
if (i != gene[length(gene)]) {
  if (any(i == gene[seq(1, length(gene), by = 7)])) {
    plot_list_vln_df[[i]] <- vln_df[[i]] %>%
      ggplot(mapping = aes(x = Subset, y = Expression)) +
      geom_violin(mapping = aes(fill = Subset), scale = "width") +
      scale_fill_manual(values = alpha((mycolors), 0.9)) +
      geom_boxplot(outlier.size = 0.01, width = 0.3, size = 0.5, alpha = 0.4) +
      theme_bw() +
      xlab("") +
      ggtitle(label = i) +
      stat_pvalue_manual(pwc[[i]], hide.ns = F, y.position = y.position, label = "FDR.signif", size = p.val.size, tip.length = 0) +
      labs(subtitle = get_test_label(vln_df[[i]] %>% kruskal_test(Expression ~ Subset) %>% mutate(KW_FDR = p.adjust(p, method = 'BH', n = length(gene))) %>% add_significance(p.col = "KW_FDR"), p.col = "KW_FDR.signif", detailed = F, description = "KW (FDR)")) +
      ylim +
      theme(panel.grid = element_blank(), axis.title.y = element_text(size = 12), axis.text.y = element_text(size = 12), axis.text.x = element_blank(), axis.ticks.x = element_blank(), plot.title = element_text(hjust = 0.5, size = plot.title.size, face = "bold"), plot.subtitle = element_text(size = 9)) +
      ylab("Expression") +
      theme(legend.position = "none", aspect.ratio = 1)
  } else {
    plot_list_vln_df[[i]] <- vln_df[[i]] %>%
      ggplot(mapping = aes(x = Subset, y = Expression)) +
      geom_violin(mapping = aes(fill = Subset), scale = "width") +
      scale_fill_manual(values = alpha((mycolors), 0.9)) +
      geom_boxplot(outlier.size = 0.01, width = 0.3, size = 0.5, alpha = 0.4) +
      theme_bw() +
      xlab("") +
      ggtitle(label = i) +
      stat_pvalue_manual(pwc[[i]], hide.ns = F, y.position = y.position, label = "FDR.signif", size = p.val.size, tip.length = 0) +
      labs(subtitle = get_test_label(vln_df[[i]] %>% kruskal_test(Expression ~ Subset) %>% mutate(KW_FDR = p.adjust(p, method = 'BH', n = length(gene))) %>% add_significance(p.col = "KW_FDR"), p.col = "KW_FDR.signif", detailed = F, description = "KW (FDR)")) +
      ylim +
      theme(panel.grid = element_blank(), axis.title.y = element_text(size = 12), axis.text.y = element_text(size = 12), axis.text.x = element_blank(), axis.ticks.x = element_blank(), plot.title = element_text(hjust = 0.5, size = plot.title.size, face = "bold"), plot.subtitle = element_text(size = 9)) +
      theme(legend.title = element_text(size = 12), legend.text = element_text(size = 12), legend.key.size = unit(0.3, "cm"), aspect.ratio = 1) +
      ylab("Expression")
  }
} else {
  plot_list_vln_df[[i]] <- vln_df[[i]] %>%
    ggplot(mapping = aes(x = Subset, y = Expression)) +
    geom_violin(mapping = aes(fill = Subset), scale = "width") +
    scale_fill_manual(values = alpha((mycolors), 0.9)) +
    geom_boxplot(outlier.size = 0.01, width = 0.3, size = 0.5, alpha = 0.4) +
    theme_bw() +
    xlab("") +
    ggtitle(label = i) +
    stat_pvalue_manual(pwc[[i]], hide.ns = F, y.position = y.position, label = "FDR.signif", size = p.val.size, tip.length = 0) +
    labs(subtitle = get_test_label(vln_df[[i]] %>% kruskal_test(Expression ~ Subset) %>% mutate(KW_FDR = p.adjust(p, method = 'BH', n = length(gene))) %>% add_significance(p.col = "KW_FDR"), p.col = "KW_FDR.signif", detailed = F, description = "KW (FDR)")) +
    ylim +
    theme(panel.grid = element_blank(), axis.title.y = element_text(size = 12), axis.text.y = element_text(size = 12), axis.text.x = element_blank(), axis.ticks.x = element_blank(), plot.title = element_text(hjust = 0.5, size = plot.title.size, face = "bold"), plot.subtitle = element_text(size = 9)) +
    theme(legend.title = element_text(size = 12), legend.text = element_text(size = 12), legend.key.size = unit(0.3, "cm"), aspect.ratio = 1) +
    ylab("Expression")
}
}