I am trying to animate a ggplot, but the animation doesn't match the normal plot. It skips some of the geom_points. I have three columns start_date, country, and total. I want to animate the total according to start_date, and all the countries should start from 1. Thanks

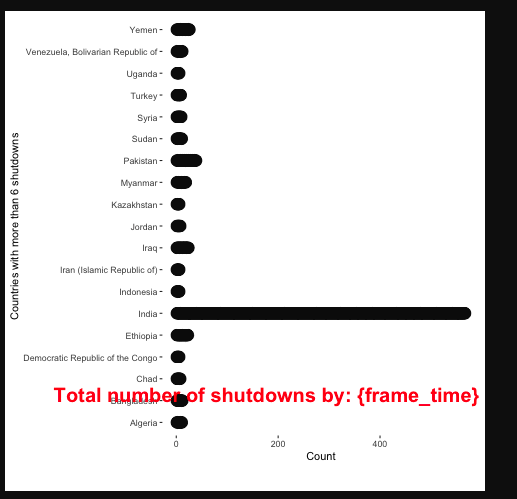
anim <- country_total %>% ggplot(aes(x = country_total$country, y= country_total$total, Label = country))+
geom_point(size = 5)+
coord_flip()+
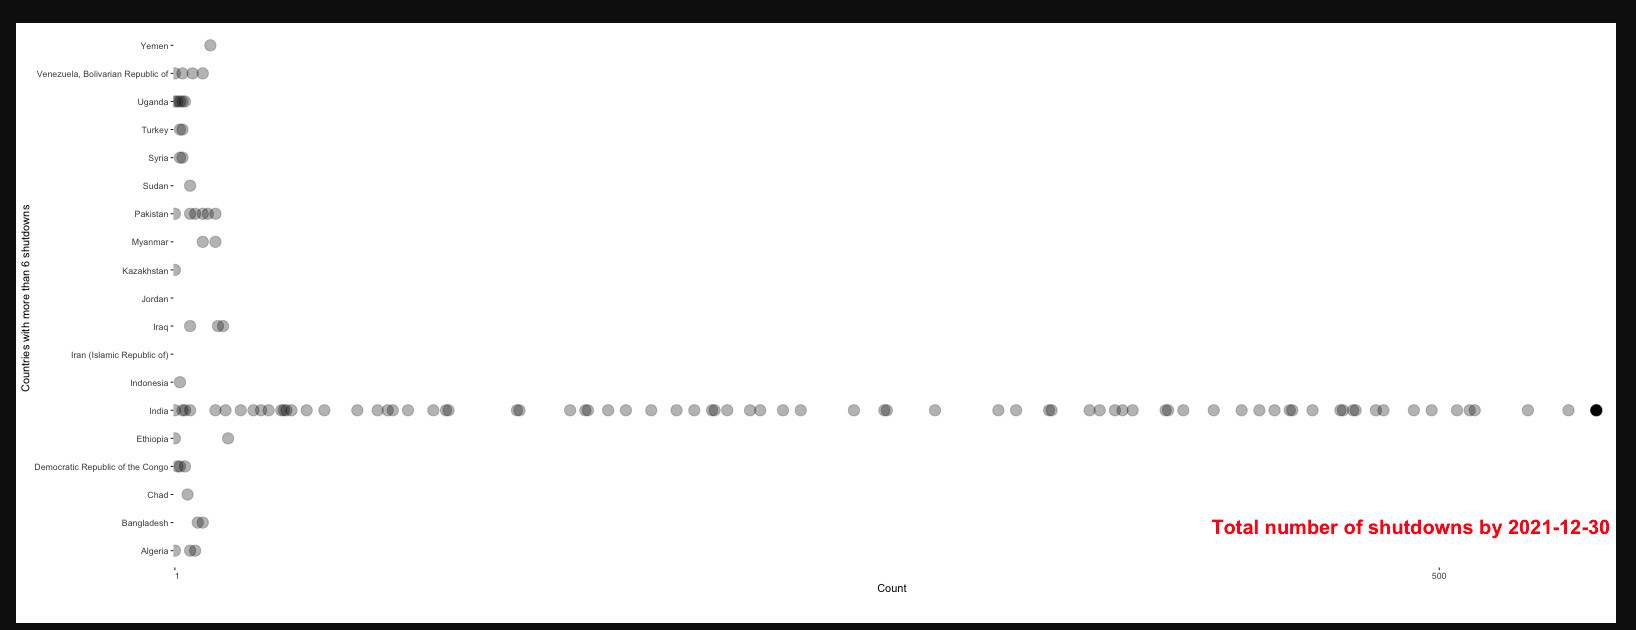
labs(x= "Countries with more than 6 shutdowns", y= "Count", caption = paste("Total number of shutdowns by: {frame_time}")) +
transition_time(start_date)+
#ease_aes("linear")+
shadow_mark(past = T, future=F, alpha=0.3)+
theme(panel.background = element_blank(),
plot.caption= element_text(size=20,
color="red",
face="bold",
vjust = 20)
)+
scale_y_discrete(limits = c(1, 500))
#geom_text(aes(label = count, vjust = -50))+
animate(anim, width=1600, height=600, renderer = gifski_renderer(loop = FALSE))