Hi all, (thank you in advance for any feedback) I am having difficulty creating an animation with my data set. It is one animal but I would like to display all the years it produced a signal simultaneously (I.e. three years playing at one).
The code below follows an example I found online works up until I run the line #display animation
It produces an error:
Error in seq.default(range[1], range[2], length.out = nframes) :
'from' must be a finite number
In addition: Warning messages:
1: In min(x) : no non-missing arguments to min; returning Inf
2: In max(x) : no non-missing arguments to max; returning -Inf
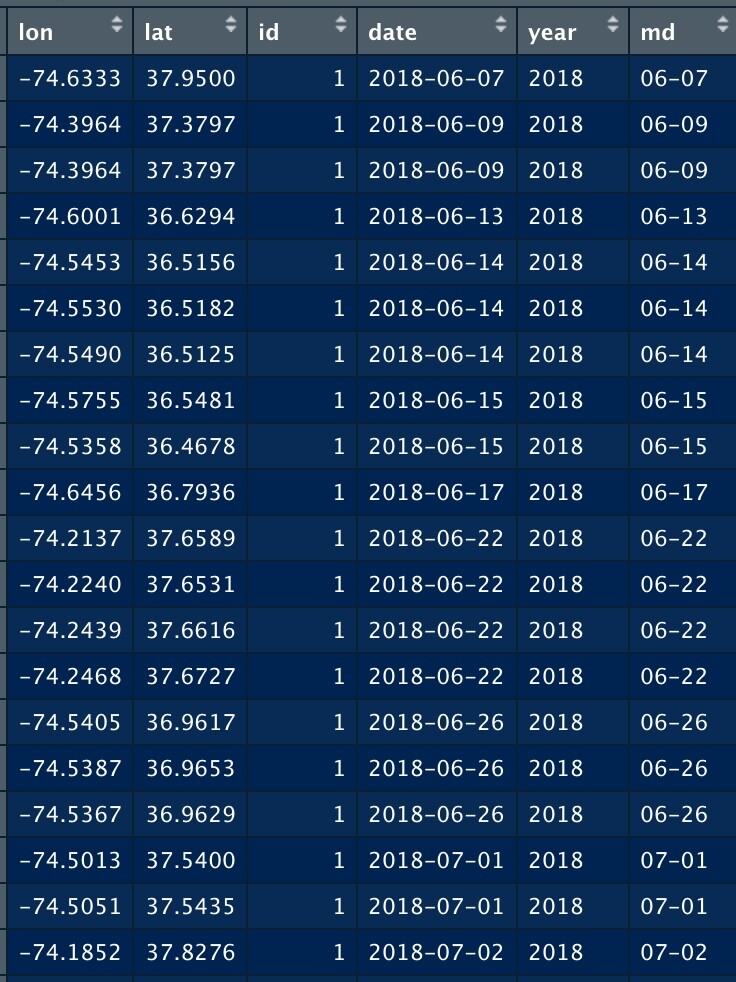
my data looks like this:
I cannot figure out a work around to this, data is basically latitude and longitude that continues from 2018-2020. I want to have 2018,2019, and 2020 animated at the same time so I tried called 2018 id 1, 2019 id 2, 2020 id 3 (Which didn't work). Additionally, the md column is the date without YYYY so that I can show all three years at the same time using their months.
Data table "HPgeo"
 Data cleanup
HP<- na.omit(HP)


HPsp <- HP
coordinates(HPsp) <- c("lon", "lat")

# SET CRS
proj4string(HPsp) <- CRS("+proj=longlat +ellps=WGS84 +datum=WGS84 +no_defs")

HPsp <- spTransform(HPsp, CRS("+init=EPSG:4326"))

# make back into DF
HPgeo <- as.data.frame(HPsp@coords)
HPgeo$id <- HPsp@data$id # add individual identifier
HPgeo$date <- as.Date(HPsp@data$date)
HPgeo$year <- format(HPgeo$date, format="%Y")
HPgeo$md<-format(HPgeo$date, format="%m-%d")

# Static map
mybasemap <- get_stamenmap(bbox = c(left = -85,
                                    bottom = 10,
                                    right = -45,
                                    top = 45),
                           zoom = 5)
mybasemap


mymap.paths <-ggmap(mybasemap) +
  geom_point(data = HPgeo, aes(x = lon, y = lat, colour = year)) +
  geom_path(data = HPgeo, aes(x = lon, y = lat, colour = year, group = year)) +
  labs(x = "Longitude", y = "Latitude") +
  scale_colour_manual(name = "Turtle number",
                      # Adjust the number of values for how many animals you have
                      values = c("red", "blue", "purple"),
                      # Enough breaks for every animal in the data set
                      breaks = unique(HPgeo$year)) +
  theme(legend.position = "bottom")

mymap.paths

# update plot to animate
path.animate.plot <- mymap.paths +
  transition_reveal(along = md) +
  labs(title = 'Date: {frame_along}')  # Add a label on top to say what date each frame is

# display animation
gganimate::animate(path.animate.plot,
        fps = 3, # frames per second
        nframes = 200) # default is 100 frames

Again, any help is appreciated.