I don't know anything about Sweden, but a good bet if you're looking for a basemap like this would be to Google something like "sweden county geojson" of "sweden county shapefile". Using that search, I ended up on this site that has county and municipal boundaries available via API -- cool!
Here's an example of how to download those files and read them into R as sf objects which you can then map with ggplot2, tmap, leaflet, etc.
library(sf)
#> Warning: package 'sf' was built under R version 3.6.3
#> Linking to GEOS 3.8.0, GDAL 3.0.4, PROJ 6.3.1
tmp1 <- tempfile()
tmp2 <- tempfile()
download.file("http://api.thenmap.net/v2/se-4/geo/2020-06-03", destfile = tmp1)
download.file("http://api.thenmap.net/v2/se-7/geo/2020-06-03", destfile = tmp2)
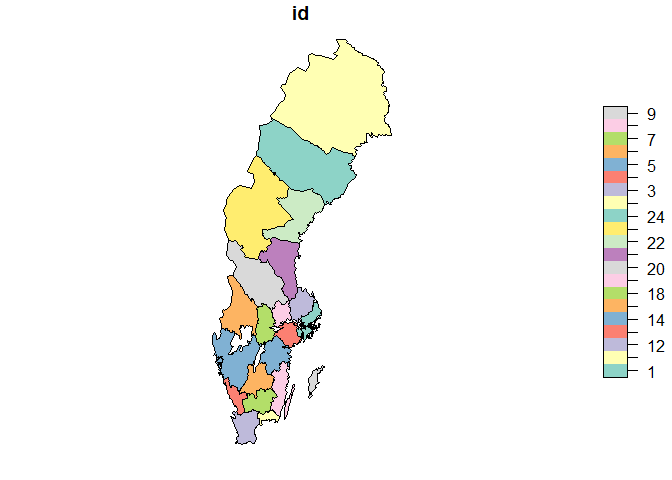
county <- read_sf(tmp1)
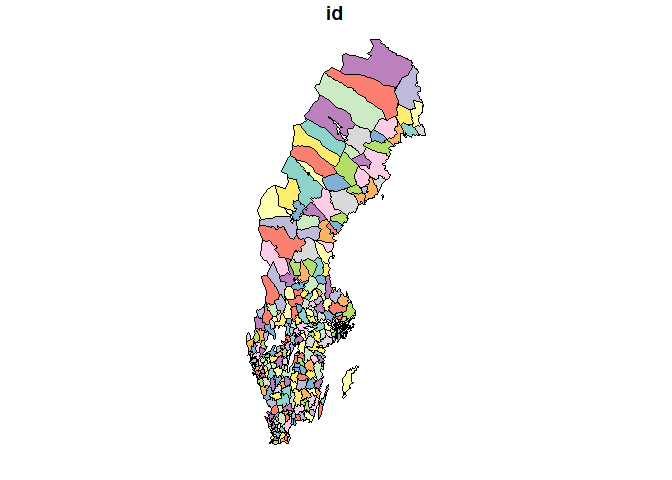
mun <- read_sf(tmp2)
plot(mun)
plot(county)
Created on 2020-06-03 by the reprex package (v0.3.0)