Thank you @GreyMerchant,
I have read and expanded a code a bit and now I have got this:
ggplot(my_variable, aes(x = my_variable)) + geom_histogram(aes(y=..density..), position = "identity", binwidth=2, color="#e9ecef", alpha=0.9) + stat_density(col = "red", size = 1, alpha=.1) +
 ggtitle("My_variable histogram")  +
 theme_ipsum() +
 theme(plot.title = element_text(size=15)) +
 scale_y_continuous("Counts", breaks = round(ybreaks / (2 * n_obs), 3), labels = ybreaks) +
 scale_y_continuous("Density", sec.axis = sec_axis(
  trans = ~ . * 2 * n_obs, name = "Counts", breaks = ybreaks)) + scale_x_continuous(breaks = seq(0, 25, 2.5), lim = c(0, 25)) + scale_x_continuous(breaks = breaks, labels = labels, limits = c(-5,30)) +
scale_x_continuous(breaks = scales::pretty_breaks(n = 20)) +
 geom_vline(xintercept=mean(my_variable$my_variable), color="green", size = 1) +
 geom_vline(xintercept=median(my_variable$my_variable), color="purple", size = 1)
labs(x = "my_variable") +
 geom_bar(stat = "count") +
stat_count(geom = "text", colour = "white", size = 3.5,
aes(label = ..count..),position=position_stack(vjust=0.5))


my_variable <- c(
  12.901, 5.605, 7.959, 7.824, 17.713, 16.642, 20, 16.44, 18.783,
  8.145, 8.539, 8.081, 4.389, 5.972, 18.69, 14.026, 12.01, 1.933,
  1, 17.341, 15.358, 17.801, 13.872, 17.018, 9.63, 17.894, 11.272,
  5.542, 6.514, 17.892
)


my_variable <- data.frame(my_variable)

library(tidyverse)
library(hrbrthemes)


n_obs = sum(!is.na(my_variable$b))


ybreaks = seq(0, 25,5)

n_obs = sum(!is.na(my_variable$b))

breaks <- seq(0, 25, 2.5)

labels <- as.character(breaks)
labels[!(breaks %% 2.5 == 0)] <- ''
tick.sizes <- rep(.5, length(breaks))
tick.sizes[(breaks %% 2.5 == 0)] <- 1
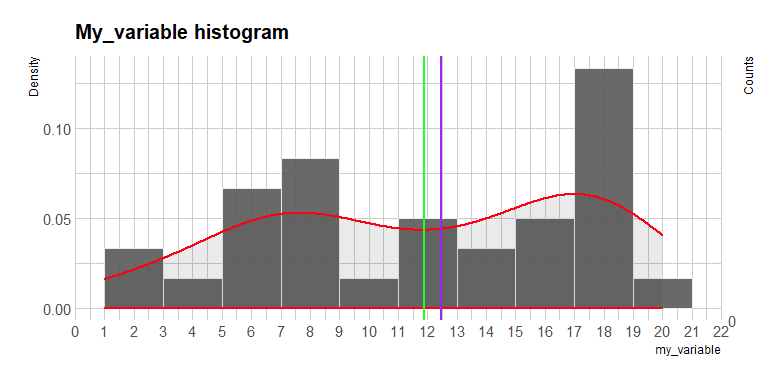
and I would like to place number of values on each bin (and percent of total), I have tried as you can see, but it
not gives me what I want. Please help.
Something like in here:
https://forum.posit.co/t/labels-in-histograms/118194
best,