Good evening everyone.
Guys, could you please tell me how to get an avg ride length like in the screenshot below?
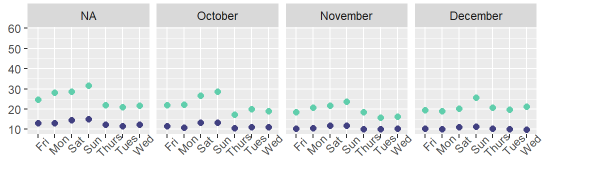
This is my code. When I run it I get this
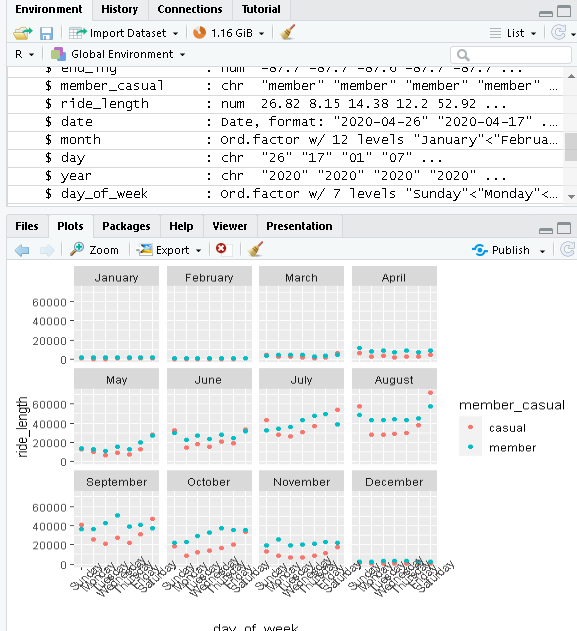
ggplot(viz_3,aes(x=day_of_week, y = ride_length, fill=member_casual, color=member_casual))+geom_jitter(stat = 'identity',
                    position = 'dodge')+ facet_wrap(~month)+theme(
                      axis.text.x = element_text(angle = 45))
these are codes i ran previously to order days
bike_rides$date <- as.Date(bike_rides$started_at)
bike_rides$month <- format(as.Date(bike_rides$date), "%B")
bike_rides$day <- format(as.Date(bike_rides$date), "%d")
bike_rides$year <- format(as.Date(bike_rides$date), "%Y")
bike_rides$day_of_week <- weekdays(bike_rides$date)
bike_rides$day_of_week <- ordered(bike_rides$day_of_week, levels = c("Sunday", "Monday",

                  "Tuesday", "Wednesday","Thursday", "Friday", "Saturday"))

bike_rides$month <- ordered(bike_rides$month, levels=c("January","February","March",

                  "April","May","June","July","August","September","October","November","December"))