Hi everybody,
I am writing to you for a suggestion, to learn the "best" method.
I have the following dataframe and I want to plot two variables (med_tmin, med_tmax) simultaneously. On the x axis there are the months, on the y axis the temperature and I would like a line for each year.
If the variable x were not repeated (every year has the same months) I would proceed using pivot_longer and using "color" in aes to divide med_tmax and med_tmin.
But in the following case it doesn't work. The workaround is to use the dataframe in wide format and map the y into two geom_line, obviously the legend does not appear (maybe you could force it by inserting it in aes) but I think this is not a clean solution.
In these cases, what workaround do you usually use?
Good day, Filippo
library(tidyverse)
set.seed(1)
temp <-tibble(year = rep(2001:2002, each = 24),
month = rep(month.abb, 4),
day = sample(1:30, 48, replace = T),
tmin = sample(0:15, 48, replace = T),
tmax = sample(20:35, 48, replace = T))
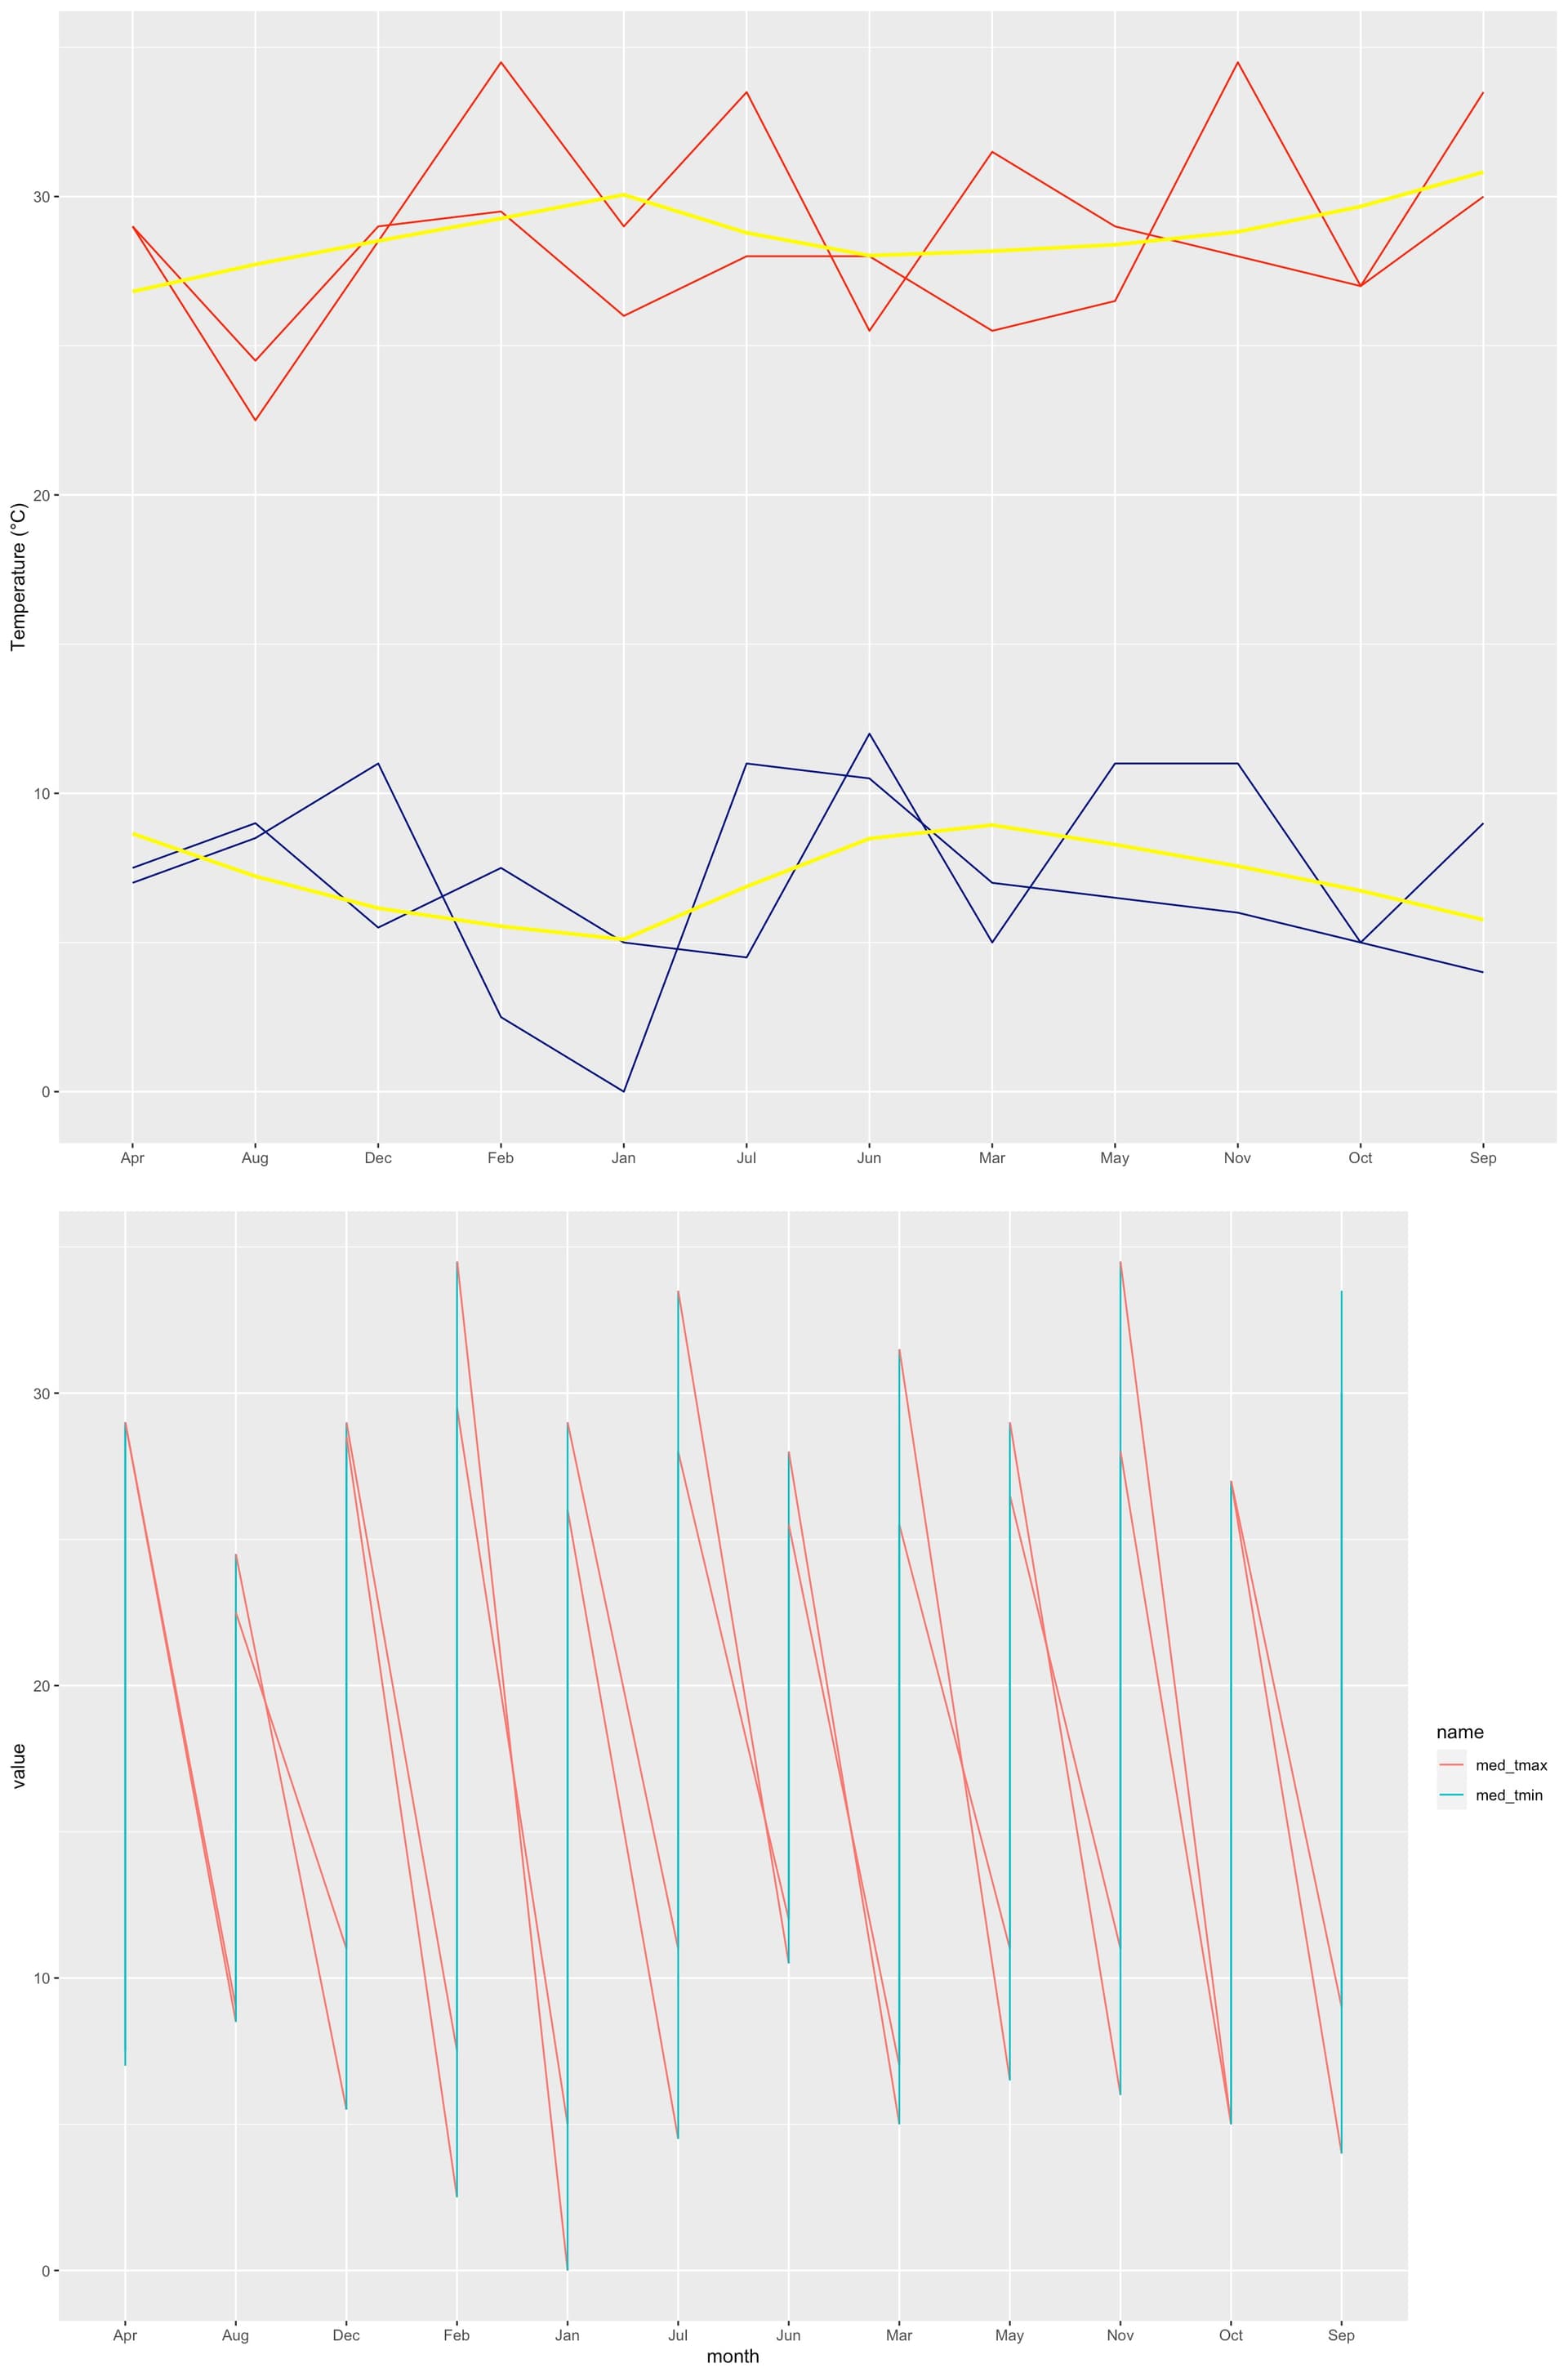
# works fine but legend is not automatically mapped (not in aes)
temp %>%
group_by(year, month) %>%
summarise(med_tmin = mean(tmin),
med_tmax = mean(tmax)) %>%
ggplot(aes(x = month, group = year)) +
geom_line(aes(y = med_tmin), color = "navyblue") +
geom_line(aes(y = med_tmax), color = "red") +
geom_smooth(aes(group = 1, y = med_tmin), se = F, color = "yellow") +
geom_smooth(aes(group = 1, y = med_tmax), se = F, color = "yellow") +
labs(x= NULL, y = "Temperature (°C)")
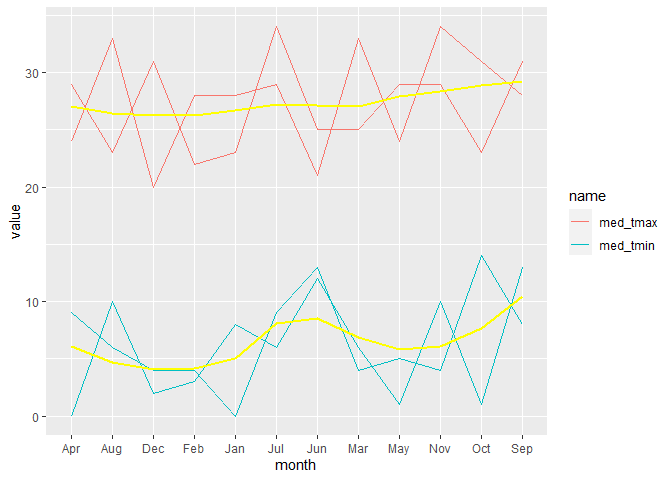
# long format
temp %>%
group_by(year, month) %>%
summarise(med_tmin = mean(tmin),
med_tmax = mean(tmax)) %>%
pivot_longer(cols = c(med_tmin, med_tmax)) %>%
ggplot(aes(x = month, y = value, color = name, group = year)) +
geom_line()