"Hi experts,
I have run a ggplot using the code below, but I would like to make a small revision to the results.
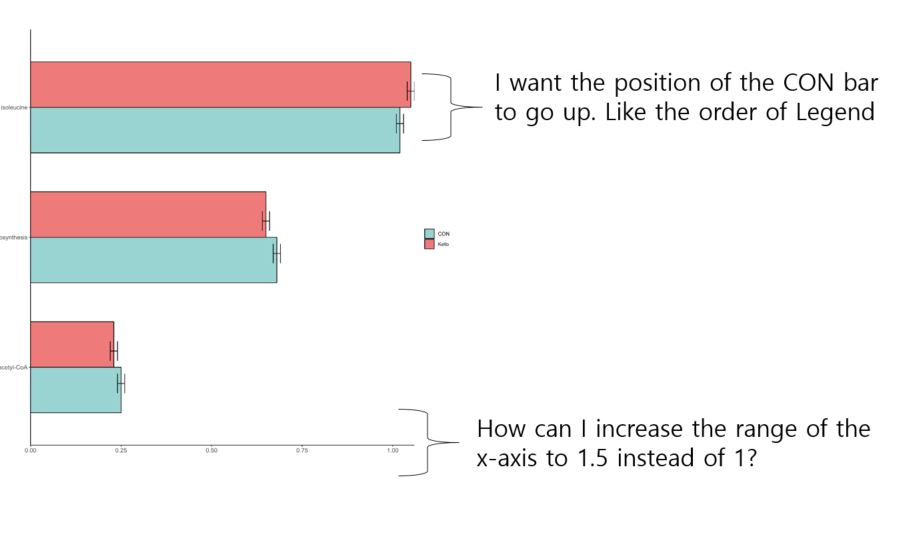
Specifically, I would like to switch the position of two bars in the chart.
Is there a way to move the CON bar up?"
Moreover, how can I increase the range of the x-axis to 1.5 instead of 1?
library(tidyverse)
library(readxl)
library(ggplot2)
families <- tibble::tribble(
~class, ~domain, ~phylum, ~family, ~genus, ~mean, ~sd,
"CON", "module", "M00019", "Valine/isoleucine biosynthesis, pyruvate => valine / 2-oxobutanoate => isoleucine", "Amino acid metabolism", 1.02, 0.01,
"CON", "module", "M00032", "Lysine degradation, lysine => saccharopine => acetoacetyl-CoA", "Amino acid metabolism", 0.25, 0.01,
"CON", "module", "M00124", "Pyridoxal-P biosynthesis", "Metabolism of cofactors and vitamins", 0.68, 0.01,
"Keto", "module", "M00019", "Valine/isoleucine biosynthesis, pyruvate => valine / 2-oxobutanoate => isoleucine", "Amino acid metabolism", 1.05, 0.01,
"Keto", "module", "M00032", "Lysine degradation, lysine => saccharopine => acetoacetyl-CoA", "Amino acid metabolism", 0.23, 0.01,
"Keto", "module", "M00124", "Pyridoxal-P biosynthesis", "Metabolism of cofactors and vitamins", 0.65, 0.01
)
p<- ggplot(families, aes(x=family, y=mean, fill=class)) +
geom_bar(stat="identity", color="black", width = 0.7,
position=position_dodge()) + coord_flip() +
geom_errorbar(aes(ymin=mean-sd, ymax=mean+sd), width=0.3,position=position_dodge(0.5))
Finished bar plot
p+labs(y = "Relative abundance (%)")+
theme_classic() +
theme(legend.position = NULL) +
theme(axis.text.y = element_text(size = 10)) +
theme(axis.text.x = element_text(size = 10)) +
theme(axis.title.x = element_blank()) +
theme(axis.title.y = element_blank()) +
scale_y_continuous(expand = c(0,0)) +
scale_fill_manual(name=NULL,
breaks = c("CON", "Keto"),
labels = c("CON", "Keto"),
values = c ("#99D4D3","#EE7B7A"))