I'm triying to include different figures in a ggplot, but the package is not recognizing unicodes. For example, when I try this:
library(dplyr)
library(tidyverse)

ig_5 <- data.frame(
  category = c("A", "B", "C", "D", "E", "F"),
  prop = c(0.1, 0.2, 0.15, 0.25, 0.05, 0.25)) %>%
  mutate(lab.ypos = cumsum(prop) - 0.5*prop,
         lab.ypos2 = cumsum(prop) + 0.3*prop)


ggplot(ig_5, aes(x = 2, y = prop, fill = prop)) +
  geom_bar(stat = "identity", color = "white") +
  coord_polar(theta = "y", start = 0) +
  geom_text(aes(y = lab.ypos, label = prop), color = "black", size = 5) +
  geom_label(aes(y = lab.ypos,
                 label = "\u26AA"),
			     vjust = 1.5,
             color = 'red') +
  xlim(.5, 2.5)
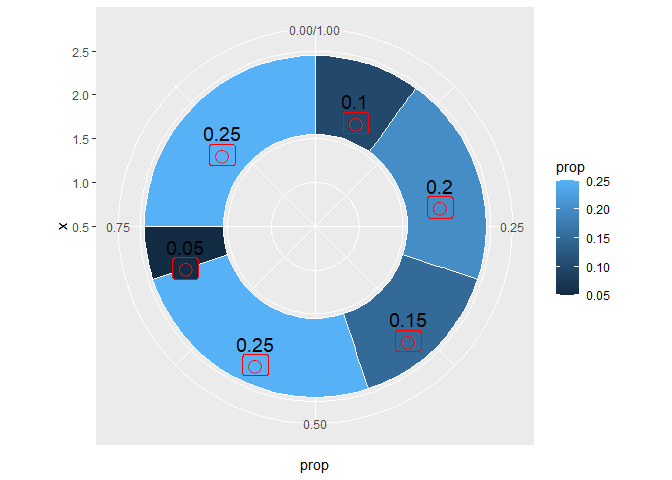
I get this:

The problem appears only with ggplot. If I print this: "\u26AA", I get what i should.
"⚪"
Moreover, the problem is not present in R, only in Rstudio.
My session info is the following:
R version 4.3.0 (2023-04-21 ucrt)
Platform: x86_64-w64-mingw32/x64 (64-bit)
Running under: Windows 11 x64 (build 22621)

Matrix products: default


locale:
[1] LC_COLLATE=Spanish_Ecuador.utf8  LC_CTYPE=Spanish_Ecuador.utf8    LC_MONETARY=Spanish_Ecuador.utf8 LC_NUMERIC=C
[5] LC_TIME=Spanish_Ecuador.utf8

time zone: America/Guayaquil
tzcode source: internal
Any ideas?