ggplot2 calendR can't use factor

Hi everyone,
I want my legend to show from the most to the less and can't seem to change the order of the variables.


here is my code

calendR(start_date = "2020-04-01",
        end_date = "2020-04-30",
        start = "S",
        orientation = "portrait",
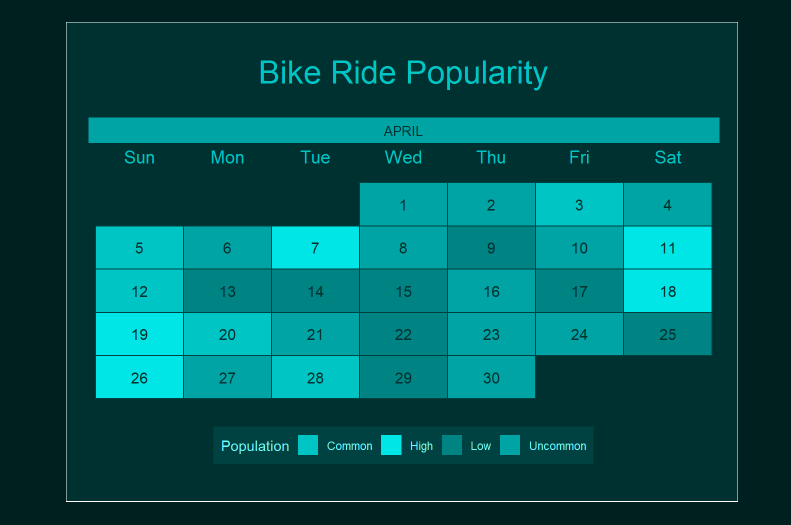
        title = "Bike Ride Popularity",
        title.size = 24,
        title.col = tblCol[12],
        col = tblCol[4],
        bg.col = tblCol[3],
        mbg.col = tblCol[10],
        months.col = tblCol[3],
        weeknames.col = tblCol[12],
        weeknames.size = 6,
        special.days = unlist(df_Agg_Popular_Date_Calendar %>%
          dplyr::arrange(Day) %>%
          dplyr::select(Part)),
        special.col = c(tblCol[8],
                        tblCol[10],
                        tblCol[12],
                        tblCol[14]
                        )[order(c("Low", 
                                  "Uncommon", 
                                  "Common", 
                                  "High"))],
        low.col = tblCol[8],
        days.col = tblCol[3],
        day.size = 4,
        legend.pos = "bottom",
        legend.title = "Population"
        ) +
  theme(legend.background = element_rect(fill = tblCol[4]),
        legend.key = element_rect(fill = tblCol[4]),
        legend.text = element_text(color = tblCol[22]),
        legend.title = element_text(color = tblCol[22])
        )

When I try to put this before my code

df_Agg_Popular_Date_Calendar$Part <- factor(df_Agg_Popular_Date_Calendar$Part, 
                                            levels = c("Low", 
                                                       "Uncommon", 
                                                       "Common", 
                                                       "High"))

a new error comes up:
"Error in if (any(special.days > length(dates))) { :
Missing value where TRUE/FALSE needed "

The code works without factor but the legend isn't ordered properly.

There is also that white frame around inside the image I can't remove I tried

theme(rect = element_rect(fill = NA), 
      aspect.ratio = 0.37)

but both don't resolve it and am not sure how to approach that as a dark mode user.

To order the legend from most to least, you can use the scale_*_discrete functions from the scales package. You should use scale_color_discrete(), scale_fill_discrete(), or scale_shape_discrete() depending on the aesthetic you want to order. You should also use the limits argument to set the order of the levels.

Here's an example of how you can use scale_fill_discrete to order the legend in your code:

df_Agg_Popular_Date_Calendar$Part <- factor(df_Agg_Popular_Date_Calendar$Part, 
                                            levels = c("Low", 
                                                       "Uncommon", 
                                                       "Common", 
                                                       "High"))

calendR(...) +
  scale_fill_discrete(limits = c("Low", "Uncommon", "Common", "High")) +
  theme(...)

Regarding the white frame, it might be a border added by the calendR function. You can try using the border argument in the calendR function to set the border to NA, like this:

calendR(..., border = NA) +

You can also try the theme(plot.background = element_rect(fill = "color"))

Also, if you are using the ggplot2 package, you can use the element_blank() function to remove the background color.

calendR(...) + 
  theme(plot.background = element_blank())

Thank you very much for the full answer I appreciate it :slight_smile:

I tried the solutions and none seem to work, I think it's a flaw with the actual calendR package;

scale_fill_discrete(limits = c("Low", "Uncommon", "Common", "High")) +
scale_fill_manual(values = c(tblCol[8],
                               tblCol[10],
                               tblCol[12],
                               tblCol[14])[order(c("Low", 
                                                   "Uncommon", 
                                                   "Common", 
                                                   "High"))]) +

I've had to set warning = FALSE since it override the actual required parameters of the function..
The order works without the color, and the color works without the order. So it's either one scale or the other and not the two at the same time.
Factor still gives the error and can't seem to make all work.

The border parameter does not exist and the border can't seem to be changed through ggplot theme.

This topic was automatically closed 21 days after the last reply. New replies are no longer allowed.

If you have a query related to it or one of the replies, start a new topic and refer back with a link.