ryamy
December 20, 2022, 11:55am
1
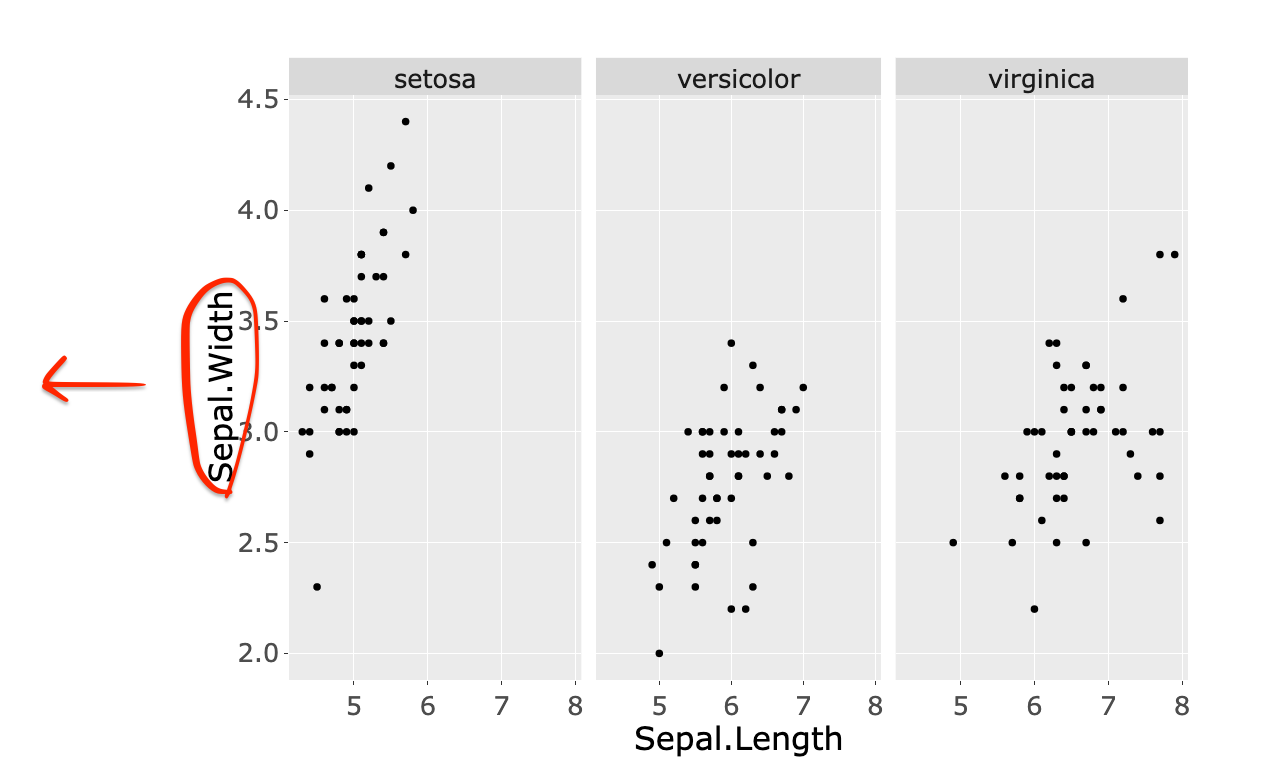
How can I adjust x/y lab title horizontally or vertically? I'd like to adjust ylab text, but following does not works.
library(dplyr)
library(ggplot2)
library(plotly)

iris %>%
    ggplot(aes(x=Sepal.Length, y=Sepal.Width)) +
    geom_point() +
    theme(text=element_text(size=24)) +
    facet_wrap(~Species) -> g


p <- ggplotly(g) %>%
    layout(margin=list(l=300, r=100, b=100, t=100),
           xaxis=list(
               title=list(standoff=25)
           ),
           yaxis=list(
               title=list(standoff=25)
           ))

htmlwidgets::saveWidget(p, './plot/iris.html')
turn it off on your ggplot and add it to your plotly explicitly like so.
iris %>%
  ggplot(aes(x=Sepal.Length, y=Sepal.Width)) +
  geom_point() +
  theme(text=element_text(size=24)) +
  facet_wrap(~Species) +
  theme(axis.title.y=element_blank()) -> g

p <- ggplotly(g) %>%
  layout(margin=list(l=300, r=100, b=100, t=100),
         yaxis=list(
           title=list(text="Sepal.Width",
                      standoff=25)
         ))
3 Likes
Hello @ryamy ,
I took a swing at this. I am not super conversant with plotly, but hereis what I observed.
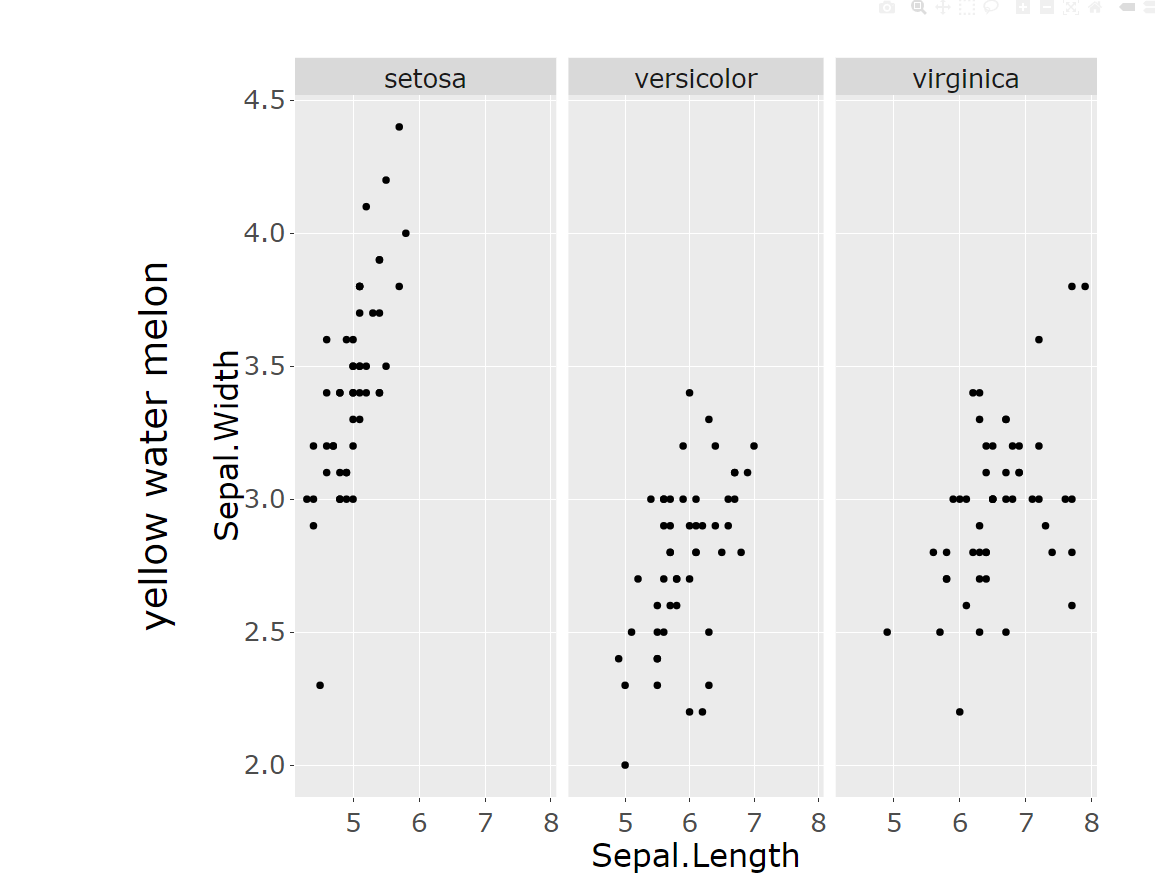
plotly works in slightly different manner when we convert a ggplot object to a plotly object using ggplotly() compared to creating plotly charts using plot_ly(). I say so after noticing this. I ran the code you have given, the standoff argument is making no difference, but it works when we provide text along with it. Take a look at below code and output
iris %>%
  ggplot(aes(x=Sepal.Length, y=Sepal.Width)) +
  geom_point() +
  theme(text=element_text(size=24)) +
  facet_wrap(~Species) -> g

 ggplotly(g) %>%
  layout(margin=list(l=300, r=100, b=100, t=100),
         xaxis=list(
           title=list(standoff=25)
         ),
         yaxis=list(
           title=list(text = "yellow water melon",standoff=50)
         ))
Notice that the yaxis title that is set by ggplot is not affected by operations in the layout(), but if the yaxis title is added in layout() then it works.
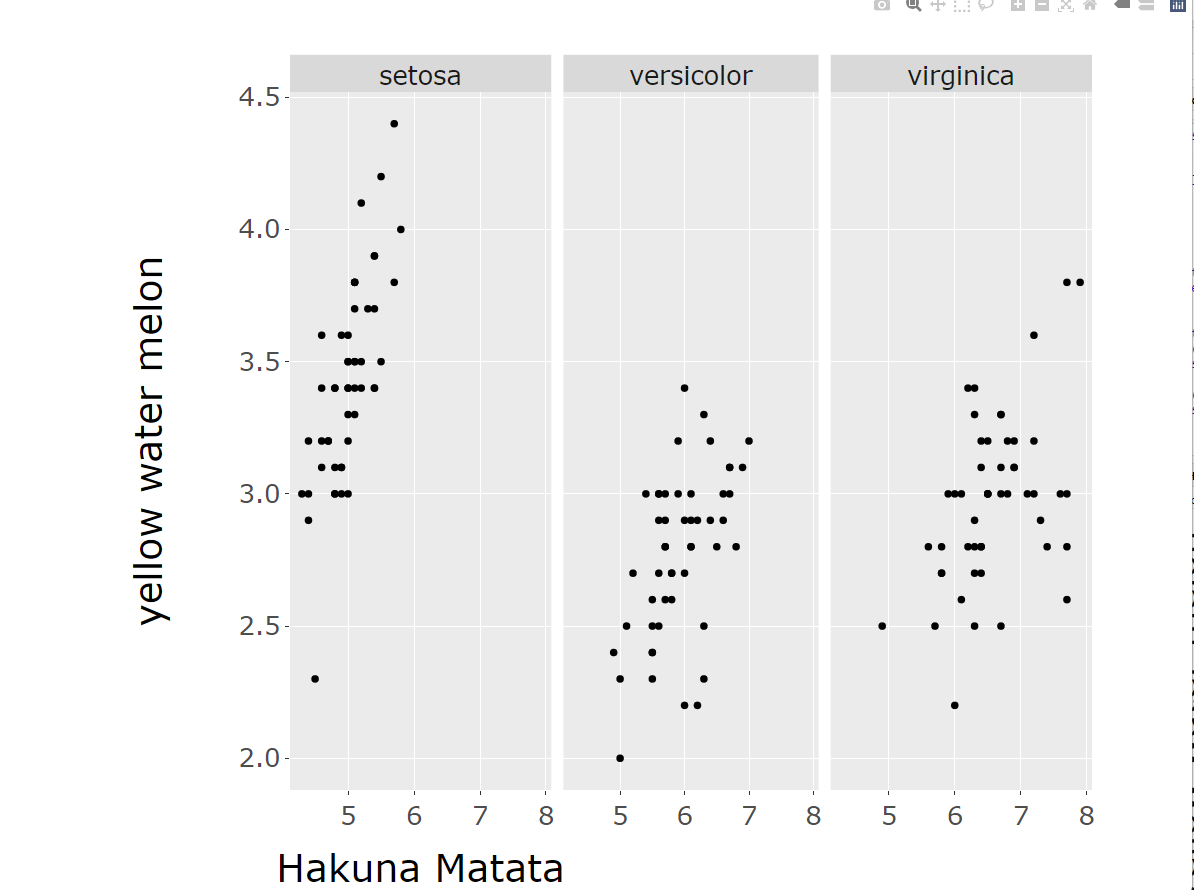
So there can be two ways around this, first, set axis titles in ggplot as NULL and then set axis titles in layout(). Second, create the chart using plot_ly() approach.
Just an example of the first way around:
iris %>%
  ggplot(aes(x=Sepal.Length, y=Sepal.Width)) +
  geom_point() +
  labs(
    x = NULL,
    y = NULL
  )+
  theme(text=element_text(size=24)) +
  facet_wrap(~Species) -> g

 ggplotly(g) %>%
  layout(margin=list(l=300, r=100, b=100, t=100),
         xaxis=list(
           title=list(text = "Hakuna Matata", standoff=25)
         ),
         yaxis=list(
           title=list(text = "yellow water melon", standoff=50)
         ))
Not a very elegant solution but hope it helps,
3 Likes
ryamy
December 21, 2022, 4:31am
4
Thanks @nirgrahamuk , @AyushBipinPatel ,
Your comments are useful for me, it works!!
Inspired by your solution and stackoverflow , I found following also works for me. Thanks!
library(dplyr)
library(ggplot2)
library(plotly)

iris %>%
    ggplot(aes(x=Sepal.Length, y=Sepal.Width)) +
    geom_point() +
    theme(text=element_text(size=24)) +
    facet_wrap(~Species) +
    labs(title='faceted')-> g1

iris %>%
    ggplot(aes(x=Sepal.Length, y=Sepal.Width)) +
    geom_point() +
    theme(text=element_text(size=24)) +
    labs(title='not faceted')-> g2

layout_ggplotly <- function(gg, x=-0.03, y=-0.03, l=200, b=200, t=200){
    ## wokrs when faceted
    gg[['x']][['layout']][['annotations']][[1]][['y']] <- x
    gg[['x']][['layout']][['annotations']][[2]][['x']] <- y
    gg %>%
        layout(margin=list(l=l, b=b, t=t))
}

layout_ggplotly_nf <- function(gg, x=10, y=10, l=200, b=200, t=100){
    ## wokrs when not faceted
    gg[['x']][['layout']][['yaxis']][['title']][['standoff']] <- y
    gg[['x']][['layout']][['xaxis']][['title']][['standoff']] <- x
    gg %>%
        layout(margin=list(l=l, b=b, t=t))
}

ggplotly(g1) %>%
    layout_ggplotly(x=-0.08, y=-0.08) -> p1
htmlwidgets::saveWidget(p1, './plot/iris.facet.html')

ggplotly(g2) %>%
    layout_ggplotly_nf(x=30, y=80) -> p2
htmlwidgets::saveWidget(p2, './plot/iris.html')
1 Like
system
December 28, 2022, 4:31am
5
This topic was automatically closed 7 days after the last reply. New replies are no longer allowed.