Graph with custom x-axis labels

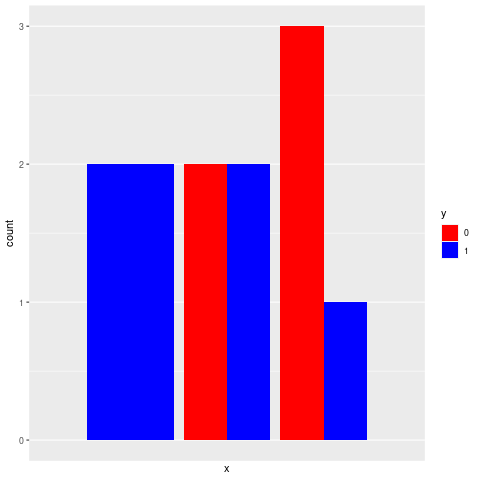
Hi. Why does my graph not show x-axis labels "0-19","20-39","40-60"?

library(ggplot2)

set.seed(123)
df <- data.frame(
x = runif(10, 0, 60),
y = round(runif(10, 0, 1),0))
df

breakpoints <- seq(from = 0, to = 60, by = 20)
names <- c("0-19","20-39","40-60")
cuts <- cut(df$x, breaks = breakpoints, labels=names)
cut_df <- data.frame(cbind(df$x,df$y, cuts))
colnames(cut_df) <- c("x","y","cuts")
cut_df

cut_df$y <- factor(cut_df$y)
ggplot(data=cut_df) +
geom_bar(mapping=aes(x=cuts, fill=y), position="dodge") +
scale_fill_manual(values=c("red", "blue")) + xlab("x") +
scale_x_discrete(labels=names)

      x y

1 17.25465 1
2 47.29831 0
3 24.53862 1
4 52.98104 1
5 56.42804 0
6 2.73339 1
7 31.68633 0
8 53.54514 0
9 33.08610 0
10 27.39688 1
x y cuts
1 17.25465 1 1
2 47.29831 0 3
3 24.53862 1 2
4 52.98104 1 3
5 56.42804 0 3
6 2.73339 1 1
7 31.68633 0 2
8 53.54514 0 3
9 33.08610 0 2
10 27.39688 1 2

image

It seems that data.frame() is dropping the names of cuts. Try this:

set.seed(123)
df <- data.frame(
  x = runif(10, 0, 60),
  y = round(runif(10, 0, 1),0))
df

breakpoints <- seq(from = 0, to = 60, by = 20)
names <- c("0-19","20-39","40-60")
cuts <- cut(df$x, breaks = breakpoints, labels=names)
cut_df <- data.frame(cbind(df$x,df$y, cuts))
colnames(cut_df) <- c("x","y","cuts")
cut_df$cuts <- factor(cut_df$cuts,labels = c("0-19","20-39","40-60"))
cut_df

cut_df$y <- factor(cut_df$y)
ggplot(data=cut_df) +
  geom_bar(mapping=aes(x=cuts, fill=y), position="dodge") +
  scale_fill_manual(values=c("red", "blue")) + xlab("x") +
  scale_x_discrete(labels=names)

FJCC,
Great, thank you!

This topic was automatically closed 7 days after the last reply. New replies are no longer allowed.

If you have a query related to it or one of the replies, start a new topic and refer back with a link.