Grouping in geom_histogram not separating

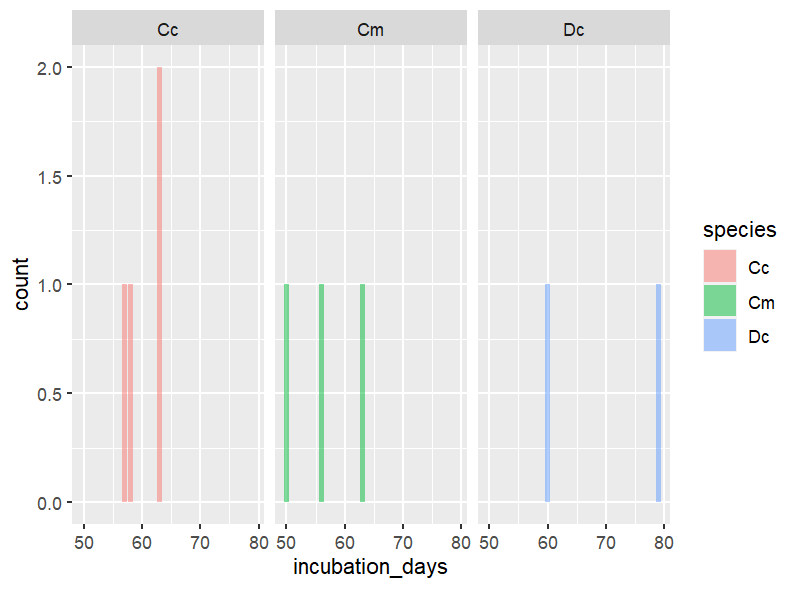
I have been trying to make a histogram of one variable incubation_days grouped by species. There are missing values, empty cells in the file. The resulting histogram has all the species together. I have recreated some data here from a big file, entering the NAs manually. I have tried making sure the species is a factor. What do I need to do? I get the same result if I use the actual file.

Thanks,
Jeff

library(tidyverse)

species <- 	c("Cc","Cc","Dc","Cc","Dc","Cc","Cc","Cc","Cc","Cc","Cc","Cm","Cm","Cm")
incubation_days <- c(NA,NA,79,63,60,NA,63,NA,58,NA,57,56,63,50)

turtle_activity_gtm1 <- data.frame(species, incubation_days)

turtle_activity_gtm1

ggplot(turtle_activity_gtm1, aes(x=incubation_days), fill=species) + 
  geom_histogram(stat="count", na.rm = TRUE, alpha = 0.5)

All aesthetic mapping has to be done inside the aes() function

ggplot(turtle_activity_gtm1, aes(x = incubation_days, fill = species)) + 
2 Likes

Aha. Thanks. When I first copied this into my script, at first it looked the same. Then I saw it.

I think that this plot is better for you understand the data. Mybe is better for you, try with all data. Add facet_grid() and put the fill variable.

ggplot(turtle_activity_gtm1, aes(x=incubation_days,fill=species)) + 
  geom_histogram(stat="count", na.rm = TRUE, alpha = 0.5) +
  facet_grid(~species)

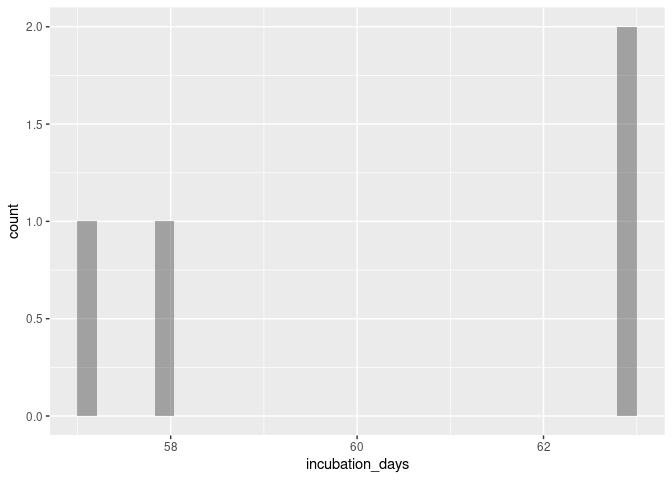
Yes, thanks about faceting. I just wanted to get the species all on one plot first. But I do have a follow up. I know I could make a data frame with only species Cc by filtering for it. However, is there a way to have the histogram showing only Cc and not the others by putting some specification for Cc in the ggplot or geom_histogram lines using the original data frame?

1 Like

It would be good to make a filter before making the graph, so you would only have to copy and replace.

filterCc<-subset(turtle_activity_gtm1,species=='Cc') #you could change for different species.

# next try the plot code

ggplot2 is not meant to be used for data wrangling so I don't think there is a way to filter the data using it and even if there is a way, it would be hacky since it is not an intended use and it would be impractical. Also, since tidyverse functions do not perform "in-place" modifications to the data, there is no harm in filtering the data before plotting, it is not going to affect your original data frame or store a new one if you do not explicitly assign the changes to a variable. You can filter on the fly by using the pipe operator (%>%), take a look at this example:

library(tidyverse)

turtle_activity_gtm1 <- data.frame(
  stringsAsFactors = FALSE,
           species = c("Cc","Cc","Dc","Cc","Dc",
                       "Cc","Cc","Cc","Cc","Cc","Cc","Cm","Cm","Cm"),
   incubation_days = c(NA, NA, 79, 63, 60, NA, 63, NA, 58, NA, 57, 56, 63, 50)
)

turtle_activity_gtm1 %>%
    filter(species == "Cc") %>% 
    ggplot(aes(x = incubation_days)) + 
    geom_histogram(na.rm = TRUE, alpha = 0.5)
#> `stat_bin()` using `bins = 30`. Pick better value with `binwidth`.

Created on 2023-01-04 with reprex v2.0.2

1 Like

This topic was automatically closed 7 days after the last reply. New replies are no longer allowed.

If you have a query related to it or one of the replies, start a new topic and refer back with a link.