Hello there,
I'm trying to tabulate the mean or average counts daily (count/number_days), stratified by period and category, and calculate the p-value using the following data frame:
library(gtsummary)

df <-
  data.frame(
    number_days= c(120,  80, 120, 80), #number of days within the 2 period groups
    count = c(1000, 400, 700, 600),
    period = c("A", "B", "A", "B"),
    category=c("Relevant", "Relevant", "Other", "Other"))
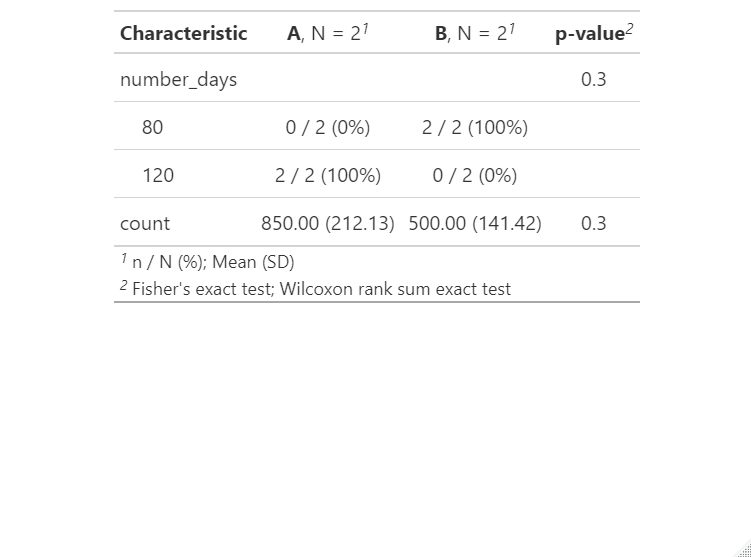
I run the script below, using tbl_summary, to determine mean count, period and category:
df %>%
  select(count, period) %>%
  tbl_summary(by = period,
              statistic = list(all_continuous() ~ "{mean} ({sd})",
              all_categorical() ~ "{n} / {N} ({p}%)"),
              digits = all_continuous() ~ 2,
              type = list(count ~ "continuous")) %>%
  add_p()
However, this doesn't work to produce what I'm intending to create, which is a 2 by 2 table with average counts and a p-value that tests for statistical significance:
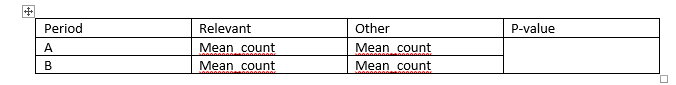
I also have the row-level data (with with an exact date variable), not just the data frame with the aggregate data. How can I go about producing what I need to produce?
Any help would be appreciated! Thanks in advance!