Help dividing gpplot2 in to two headings

Hi there,

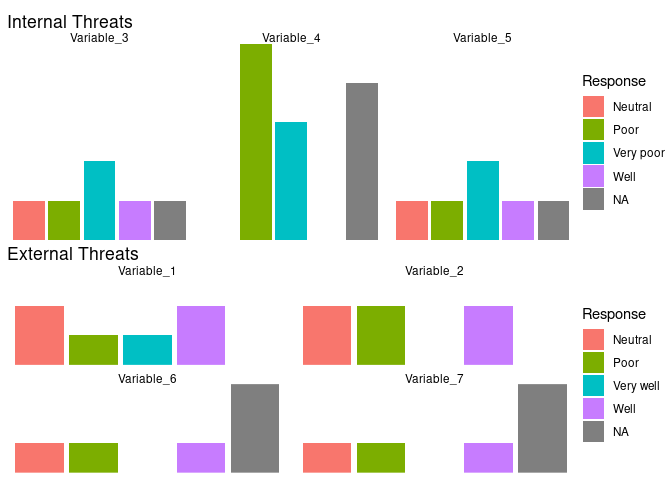
I am wanting to show a series of 7 variables divided into internal or external threats. I've been able to get part of the way - I can plot the groups separately. But when I combine the plots using patchwork, I lose the headings/subheadings making it clear which group is internal vs external threats (see below).

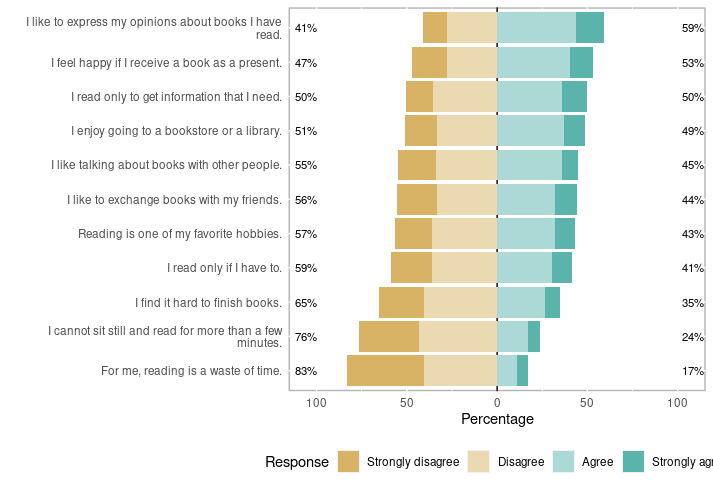
I'm not particularly wedded to this format, so if you think there is a better way to visualise the contrast between the two then I would be interested in your suggestions.

Here is my code and sample dataset:

install.packages("sjPlot")
#> 
#> The downloaded binary packages are in
#>  /var/folders/n4/v7p943711hgcdq67m0w2p2hm0000gp/T//Rtmp5LwPMX/downloaded_packages
install.packages("sjmisc")
#> 
#> The downloaded binary packages are in
#>  /var/folders/n4/v7p943711hgcdq67m0w2p2hm0000gp/T//Rtmp5LwPMX/downloaded_packages
install.packages("parameters")
#> 
#> The downloaded binary packages are in
#>  /var/folders/n4/v7p943711hgcdq67m0w2p2hm0000gp/T//Rtmp5LwPMX/downloaded_packages
install.packages("patchwork")
#> 
#> The downloaded binary packages are in
#>  /var/folders/n4/v7p943711hgcdq67m0w2p2hm0000gp/T//Rtmp5LwPMX/downloaded_packages


library(ggplot2)
library(tidyr)
library(tibble)
library(dplyr)
#> 
#> Attaching package: 'dplyr'
#> The following objects are masked from 'package:stats':
#> 
#>     filter, lag
#> The following objects are masked from 'package:base':
#> 
#>     intersect, setdiff, setequal, union
library(likert)
#> Loading required package: xtable
#> 
#> Attaching package: 'likert'
#> The following object is masked from 'package:dplyr':
#> 
#>     recode
library(RColorBrewer)
library(stringr)
library(sjPlot)
library(sjmisc)
#> 
#> Attaching package: 'sjmisc'
#> The following object is masked from 'package:tibble':
#> 
#>     add_case
#> The following object is masked from 'package:tidyr':
#> 
#>     replace_na
library(parameters)
#> 
#> Attaching package: 'parameters'
#> The following object is masked from 'package:xtable':
#> 
#>     display
library(dbplyr)
#> 
#> Attaching package: 'dbplyr'
#> The following objects are masked from 'package:dplyr':
#> 
#>     ident, sql
library(patchwork)
library(writexl)
library(reprex)

data.frame(
  stringsAsFactors = FALSE,
                                 Question = c("Varible_1",
                                              "Varible_2","Varible_3","Variable_4",
                                              "Variable_4","Variable_5",
                                              "Variable_6","Variable_7","Varible_1",
                                              "Varible_2","Varible_3",
                                              "Variable_4","Variable_4","Variable_5",
                                              "Variable_6","Variable_7",
                                              "Varible_1","Varible_2","Varible_3",
                                              "Variable_4","Variable_4",
                                              "Variable_5","Variable_6","Variable_7",
                                              "Varible_1","Varible_2",
                                              "Varible_3","Variable_4","Variable_4",
                                              "Variable_5","Variable_6",
                                              "Variable_7","Varible_1","Varible_2",
                                              "Varible_3","Variable_4",
                                              "Variable_4","Variable_5","Variable_6",
                                              "Variable_7","Varible_1",
                                              "Varible_2","Varible_3","Variable_4",
                                              "Variable_4","Variable_5",
                                              "Variable_6","Variable_7"),
                                 Response = c("Poor","Neutral",
                                              "Very poor","Very poor",NA,
                                              "Very poor",NA,NA,"Well","Well",
                                              "Well","Poor",NA,"Well","Poor",
                                              "Poor","Neutral","Poor",
                                              "Neutral","Poor",NA,"Neutral",NA,NA,
                                              "Well","Neutral","Poor",
                                              "Poor","Poor",NA,"Neutral",
                                              "Neutral","Very well","Well",
                                              "Very poor","Very poor","Very poor",
                                              "Very poor","Well","Well","Neutral",
                                              "Poor",NA,"Poor",NA,"Poor",
                                              NA,NA),
                             Question_Cat = c("External",
                                              "External","Internal","Internal",
                                              "Internal","Internal","External",
                                              "External","External","External",
                                              "Internal","Internal","Internal",
                                              "Internal","External",
                                              "External","External","External",
                                              "Internal","Internal","Internal",
                                              "Internal","External","External",
                                              "External","External","Internal",
                                              "Internal","Internal","Internal",
                                              "External","External",
                                              "External","External","Internal",
                                              "Internal","Internal","Internal",
                                              "External","External","External",
                                              "External","Internal","Internal",
                                              "Internal","Internal","External",
                                              "External")
                       )
#>      Question  Response Question_Cat
#> 1   Varible_1      Poor     External
#> 2   Varible_2   Neutral     External
#> 3   Varible_3 Very poor     Internal
#> 4  Variable_4 Very poor     Internal
#> 5  Variable_4      <NA>     Internal
#> 6  Variable_5 Very poor     Internal
#> 7  Variable_6      <NA>     External
#> 8  Variable_7      <NA>     External
#> 9   Varible_1      Well     External
#> 10  Varible_2      Well     External
#> 11  Varible_3      Well     Internal
#> 12 Variable_4      Poor     Internal
#> 13 Variable_4      <NA>     Internal
#> 14 Variable_5      Well     Internal
#> 15 Variable_6      Poor     External
#> 16 Variable_7      Poor     External
#> 17  Varible_1   Neutral     External
#> 18  Varible_2      Poor     External
#> 19  Varible_3   Neutral     Internal
#> 20 Variable_4      Poor     Internal
#> 21 Variable_4      <NA>     Internal
#> 22 Variable_5   Neutral     Internal
#> 23 Variable_6      <NA>     External
#> 24 Variable_7      <NA>     External
#> 25  Varible_1      Well     External
#> 26  Varible_2   Neutral     External
#> 27  Varible_3      Poor     Internal
#> 28 Variable_4      Poor     Internal
#> 29 Variable_4      Poor     Internal
#> 30 Variable_5      <NA>     Internal
#> 31 Variable_6   Neutral     External
#> 32 Variable_7   Neutral     External
#> 33  Varible_1 Very well     External
#> 34  Varible_2      Well     External
#> 35  Varible_3 Very poor     Internal
#> 36 Variable_4 Very poor     Internal
#> 37 Variable_4 Very poor     Internal
#> 38 Variable_5 Very poor     Internal
#> 39 Variable_6      Well     External
#> 40 Variable_7      Well     External
#> 41  Varible_1   Neutral     External
#> 42  Varible_2      Poor     External
#> 43  Varible_3      <NA>     Internal
#> 44 Variable_4      Poor     Internal
#> 45 Variable_4      <NA>     Internal
#> 46 Variable_5      Poor     Internal
#> 47 Variable_6      <NA>     External
#> 48 Variable_7      <NA>     External


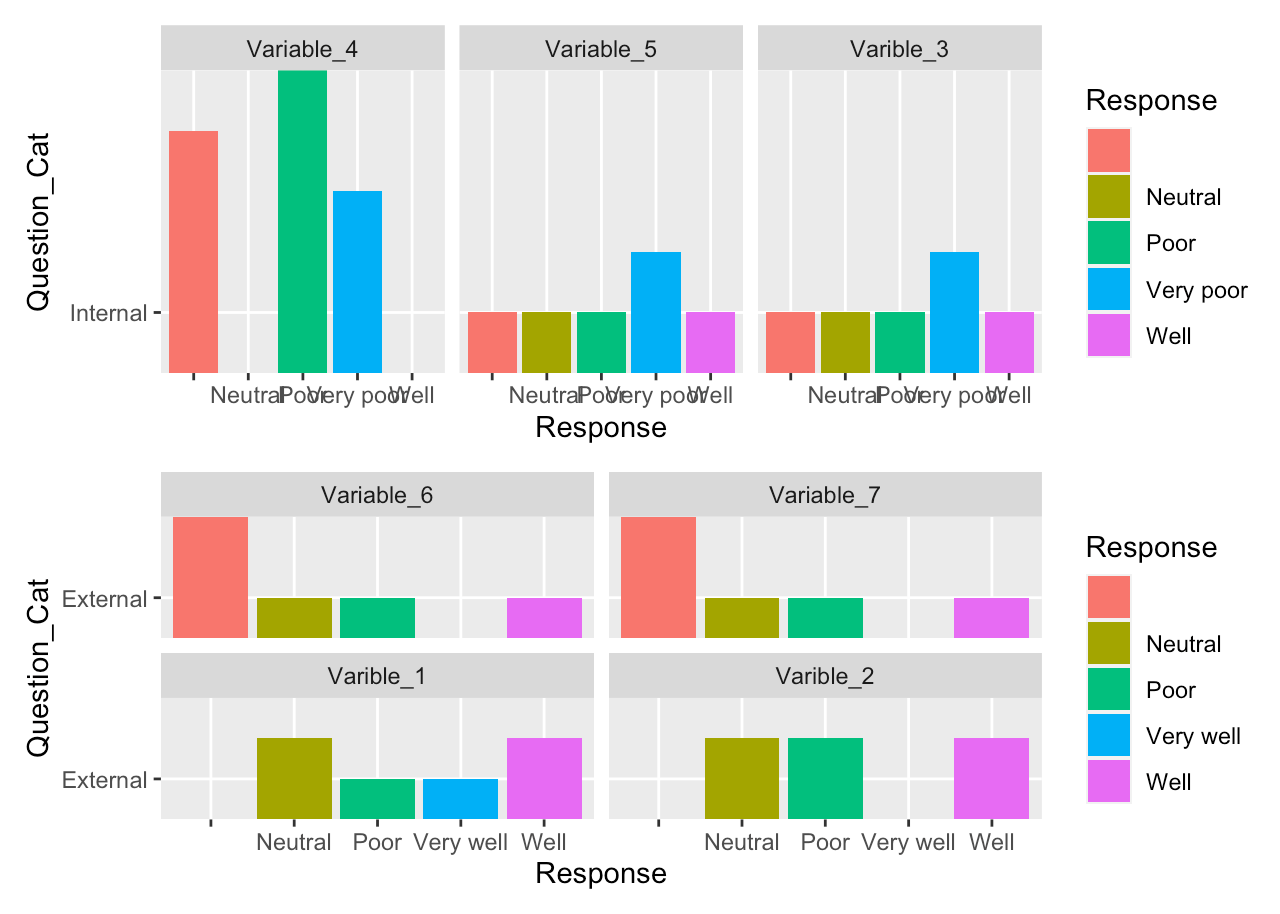
(plot_ext<-df_long %>% 
    filter(Question_Cat == "External") %>%
    group_by(Question) %>% 
    ggplot(aes(x = Response, y = Question_Cat, fill=Response)) +
    geom_bar(stat='identity')+
    facet_wrap(~Question))+
  ggtitle("External Threats")+
  xlab(NULL)+
  ylab(NULL)+
  theme(axis.text.y = element_blank())
#> Error in filter(., Question_Cat == "External"): object 'df_long' not found

(plot_int<-df_long %>% 
    filter(Question_Cat == "Internal") %>%
    group_by(Question) %>% 
    ggplot(aes(x = Response, y = Question_Cat, fill=Response)) +
    geom_bar(stat='identity')+
    facet_wrap(~Question))+
  ggtitle("Internal Threats")+
  xlab(NULL)+
  ylab(NULL)+
  theme(axis.text.y = element_blank())
#> Error in filter(., Question_Cat == "Internal"): object 'df_long' not found


plot_int + plot_ext+
  plot_layout(ncol = 1)
#> Error in eval(expr, envir, enclos): object 'plot_int' not found

Created on 2022-12-05 with reprex v2.0.2

Thank you, in advance, for any help or advice.

I would use likert::likert.plot() after refactoring the data into the required form for that function; for this way, though

library(ggplot2)
library(dplyr)
library(patchwork)

df_long <- data.frame(
  stringsAsFactors = FALSE,
  Question = c(
    "Variable_1",
    "Variable_2", "Variable_3", "Variable_4",
    "Variable_4", "Variable_5",
    "Variable_6", "Variable_7", "Variable_1",
    "Variable_2", "Variable_3",
    "Variable_4", "Variable_4", "Variable_5",
    "Variable_6", "Variable_7",
    "Variable_1", "Variable_2", "Variable_3",
    "Variable_4", "Variable_4",
    "Variable_5", "Variable_6", "Variable_7",
    "Variable_1", "Variable_2",
    "Variable_3", "Variable_4", "Variable_4",
    "Variable_5", "Variable_6",
    "Variable_7", "Variable_1", "Variable_2",
    "Variable_3", "Variable_4",
    "Variable_4", "Variable_5", "Variable_6",
    "Variable_7", "Variable_1",
    "Variable_2", "Variable_3", "Variable_4",
    "Variable_4", "Variable_5",
    "Variable_6", "Variable_7"
  ),
  Response = c(
    "Poor", "Neutral",
    "Very poor", "Very poor", NA,
    "Very poor", NA, NA, "Well", "Well",
    "Well", "Poor", NA, "Well", "Poor",
    "Poor", "Neutral", "Poor",
    "Neutral", "Poor", NA, "Neutral", NA, NA,
    "Well", "Neutral", "Poor",
    "Poor", "Poor", NA, "Neutral",
    "Neutral", "Very well", "Well",
    "Very poor", "Very poor", "Very poor",
    "Very poor", "Well", "Well", "Neutral",
    "Poor", NA, "Poor", NA, "Poor",
    NA, NA
  ),
  Question_Cat = c(
    "External",
    "External", "Internal", "Internal",
    "Internal", "Internal", "External",
    "External", "External", "External",
    "Internal", "Internal", "Internal",
    "Internal", "External",
    "External", "External", "External",
    "Internal", "Internal", "Internal",
    "Internal", "External", "External",
    "External", "External", "Internal",
    "Internal", "Internal", "Internal",
    "External", "External",
    "External", "External", "Internal",
    "Internal", "Internal", "Internal",
    "External", "External", "External",
    "External", "Internal", "Internal",
    "Internal", "Internal", "External",
    "External"
  )
)

plot_ext <- df_long %>%
  filter(Question_Cat == "External") %>%
  group_by(Question) %>%
  ggplot(aes(x = Response, y = Question_Cat, fill = Response)) +
  geom_bar(stat = "identity") +
  facet_wrap(~Question) +
  ggtitle("External Threats") +
  xlab(NULL) +
  ylab(NULL) +
  theme(axis.text.y = element_blank()) + theme_void()

plot_int <- df_long %>%
  filter(Question_Cat == "Internal") %>%
  group_by(Question) %>%
  ggplot(aes(x = Response, y = Question_Cat, fill = Response)) +
  geom_bar(stat = "identity") +
  facet_wrap(~Question) +
  ggtitle("Internal Threats") +
  xlab(NULL) +
  ylab(NULL) +
  theme(axis.text.y = element_blank()) + theme_void()

plot_int + plot_ext + plot_layout(ncol = 1)

Created on 2022-12-05 with reprex v2.0.2

1 Like

Thank you very much @technocrat! That worked. I also got the code to work without 'theme_void()'. I'm not sure why wasn't working for me initially....

When you say refactoring the data, do you mean turning the responses into numerical values? If so, how would you divide a Likert plot into internal and external threats?

Thanks again! Your help is very much appreciated.

Hi, can you please show me how would you do it with likert.plot() ?

I used theme_void because the grid lines don't really provide any useful information. By refactoring, I mean putting the data in the form expected by the {likert} package. From the vignette:

.libPaths(c("/usr/lib/R/site-library","/usr/lib/R/library"))

options(digits=2)

require(likert)
#> Loading required package: likert
#> Loading required package: ggplot2
#> Loading required package: xtable
require(plyr)
#> Loading required package: plyr
require(grid)
#> Loading required package: grid

options(digits=2)

require(likert)
data(pisaitems)

##### Item 24: Reading Attitudes
items24 <- pisaitems[,substr(names(pisaitems), 1,5) == 'ST24Q']
head(items24); ncol(items24)
#>                 ST24Q01           ST24Q02           ST24Q03           ST24Q04
#> 68038          Disagree    Strongly agree    Strongly agree Strongly disagree
#> 68039             Agree Strongly disagree Strongly disagree    Strongly agree
#> 68040    Strongly agree Strongly disagree Strongly disagree             Agree
#> 68041          Disagree          Disagree             Agree Strongly disagree
#> 68042 Strongly disagree          Disagree Strongly disagree          Disagree
#> 68043             Agree Strongly disagree Strongly disagree             Agree
#>                 ST24Q05           ST24Q06           ST24Q07           ST24Q08
#> 68038    Strongly agree Strongly disagree             Agree          Disagree
#> 68039 Strongly disagree             Agree Strongly disagree             Agree
#> 68040 Strongly disagree    Strongly agree Strongly disagree             Agree
#> 68041          Disagree          Disagree             Agree Strongly disagree
#> 68042 Strongly disagree          Disagree          Disagree             Agree
#> 68043 Strongly disagree             Agree Strongly disagree             Agree
#>                 ST24Q09           ST24Q10           ST24Q11
#> 68038 Strongly disagree             Agree             Agree
#> 68039    Strongly agree Strongly disagree Strongly disagree
#> 68040          Disagree          Disagree Strongly disagree
#> 68041 Strongly disagree             Agree             Agree
#> 68042             Agree             Agree Strongly disagree
#> 68043    Strongly agree Strongly disagree Strongly disagree
#> [1] 11

names(items24) <- c(
  ST24Q01="I read only if I have to.",
  ST24Q02="Reading is one of my favorite hobbies.",
  ST24Q03="I like talking about books with other people.",
  ST24Q04="I find it hard to finish books.",
  ST24Q05="I feel happy if I receive a book as a present.",
  ST24Q06="For me, reading is a waste of time.",
  ST24Q07="I enjoy going to a bookstore or a library.",
  ST24Q08="I read only to get information that I need.",
  ST24Q09="I cannot sit still and read for more than a few minutes.",
  ST24Q10="I like to express my opinions about books I have read.",
  ST24Q11="I like to exchange books with my friends.")


l24 <- likert(items24)
plot(l24)

1 Like

Thank you @technocrat. That makes sense. With the likert plot, is it possible to divide the data into groups? Using your example, could you divide the questions into 'book related questions' and 'reading specific questions' and still display it on the same plot? Or would you just divide the questions and produce two Likert plots?

For this example, I'd be inclined to just draw a horizontal rule between the top book-related questions and the bottom reading-related questions. But there's no guarantee that the order of questions in a given survey will necessarily cooperate. In that case I'd take the equivalent of names(items24) and divide the question numbers (ST24Q1, etc.) into the divisions desired and run separate charts.

1 Like

Thank you @technocrat. Good idea. You help and advice is much appreciated!

This topic was automatically closed 7 days after the last reply. New replies are no longer allowed.

If you have a query related to it or one of the replies, start a new topic and refer back with a link.