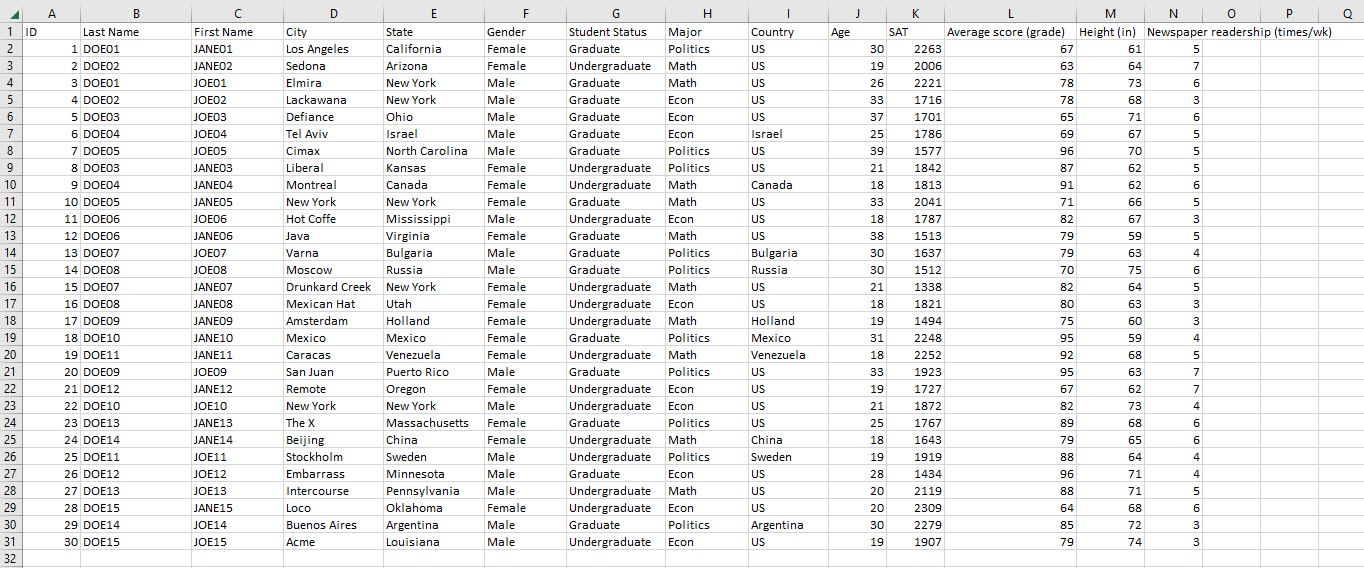
- Is the average SAT score same for graduates and undergraduates?
- Between men or women? Who reads the newspaper more frequently and which
group has more variation? (show using box plots)
Hello,
I'm sure you shared this image with the best intentions, but perhaps you didnt realise what it implies.
If someone wished to use example data to test code against, they would type it out from your screenshot...
This is very unlikely to happen, and so it reduces the likelihood you will receive the help you desire.
Therefore please see this guide on how to reprex data. Key to this is use of either datapasta, or dput() to share your data as code
Also please be aware of the sites Homework Policy :
Hi. I suggest you think about how you would answer these questions without R first, and then worry about how to answer them within R.
When you say, is the average SAT score same for graduates and undergraduates, are you asking whether the two numbers are literally equal, or are you asking whether the results of a statistical test on the equality of two sample numbers allow us to conclude something about the corresponding population numbers? The calculations are quite different.
This topic was automatically closed 21 days after the last reply. New replies are no longer allowed.
If you have a query related to it or one of the replies, start a new topic and refer back with a link.