Hi R Community,
I am hitting a stumper - and it is probably an easy fix.
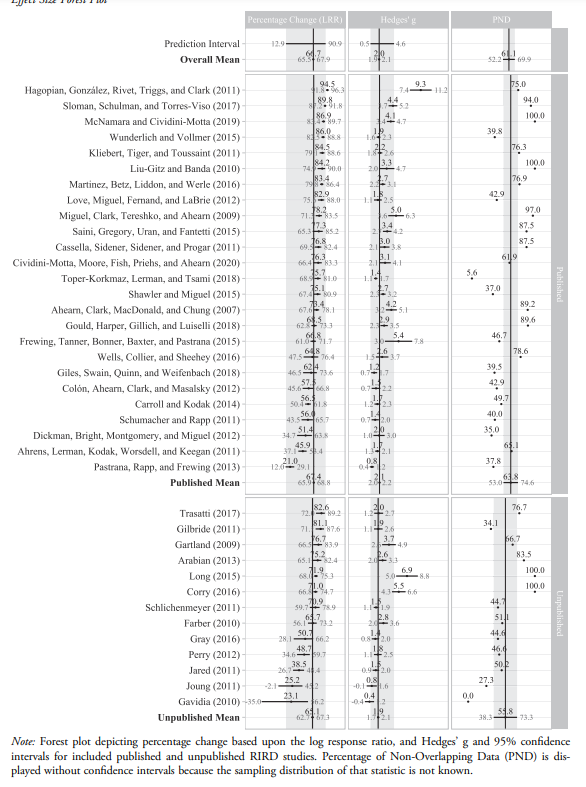
I have a forest plot that I built below and I am trying to make a few changes to it:
-
Order the studies to correspond to the TALC, where the first column is the TALC column (left one)? In other words order TALC, LRR, Hedges g.
-
Fit the published and unpublished Effect Sizes in there too with space between studies?
-
Add light grey shading to cover the confidence intervals using the "Omnibus Effect Sizes" values in the csv (i.e., Overall Median/Mean section) and then use that same shading down each column for the published and unpublished sections for all columns and remove the omnibus values at the top.
*For 2 and 3 the very bottom plot shows what the intent is.
Here is my code in markdown to create the black and white forest plot:
forest %>%
  mutate(effect_size = factor(effect_size,
                              levels = c("lrr", "hedges", "talc"),
                              labels = c("LRR (% Changed)", "Hedges' g", "TALC"))) |>
  arrange(effect_size, ES_mean) %>%
  mutate(citation = fct_inorder(citation),
         status = factor(status, levels = c("o", "p", "u"),
                         labels = c("", "Published", "Unpublished"))) %>%
  ggplot(aes(y = citation,
               x = ES_mean,
               xmin = CI_lower_mean,
               xmax = CI_upper_mean,
               color = citation)) +
      geom_pointrange() +
      geom_vline(xintercept = 0) +
      facet_grid(rows = vars(status),
                 cols = vars(effect_size),
                 scales = "free",
                 space = "free_y") +
      theme_light() +
      theme(legend.position = "none") +
      labs(y = NULL, x = "Effect Size Comparison") +
      theme(text = element_text(size = 12, family = "TT Times New Roman"))

pdf("Forest_Color.pdf")
print(forest)
dev.off()
Current plot:
Can't seem to post due to being a new user - sorry about that.
Aiming for something like the attachment with the changes (without the top prediction interval and overall mean metrics) just the shading:
Thank you for your help and guidance!