This is expected. There are two possibilities for the order of column:
1/ you set it yourself, if you use pheatmap(cluster_cols = FALSE) you will just get the order of the input.
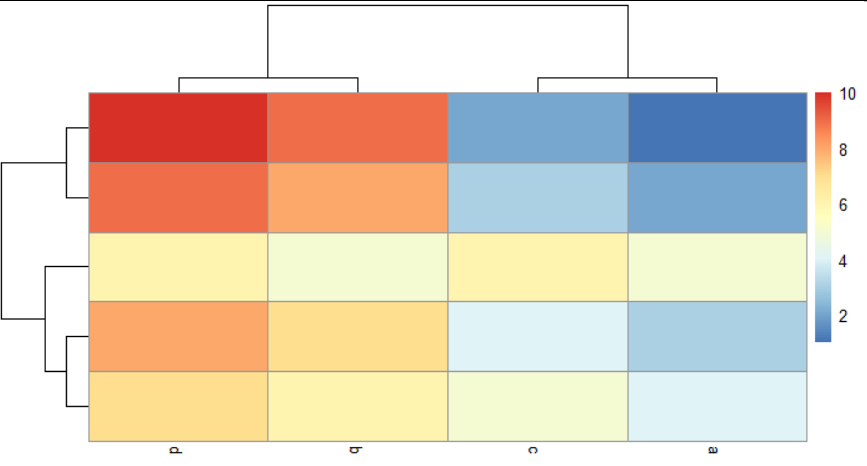
2/ you don't know the best order, you ask pheatmap() to run a hierarchical clustering for you. The algorithm will run, determining which columns are most similar to each other. It will then plot the heatmap according to that order, and draw a dendrogram on top to make this similarity explicit.
These can be illustrated with this example where columns a and c are similar; and columns b and d are similar:
my_mat <- as.matrix(data.frame(a = c(1:4),
                               b = c(9:6),
                               c = c(2:5),
                               d = c(10:7)))


pheatmap::pheatmap(my_mat)
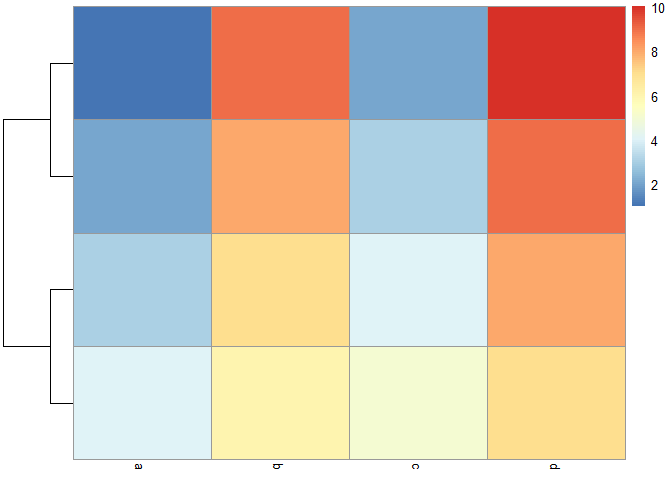
pheatmap::pheatmap(my_mat, cluster_cols = FALSE)
Created on 2022-10-17 by the reprex package (v2.0.1)
So essentially if you have a dendrogram, it's because you didn't choose the order of the columns. You can't both choose the order of columns AND have a dendrogram, as they could contradict each other.
Now there are two ways you can get more control.
1 DURING CLUSTERING/ the parameters of the hierarchical clustering algorithm: you can change the distance and the method for grouping observations used.
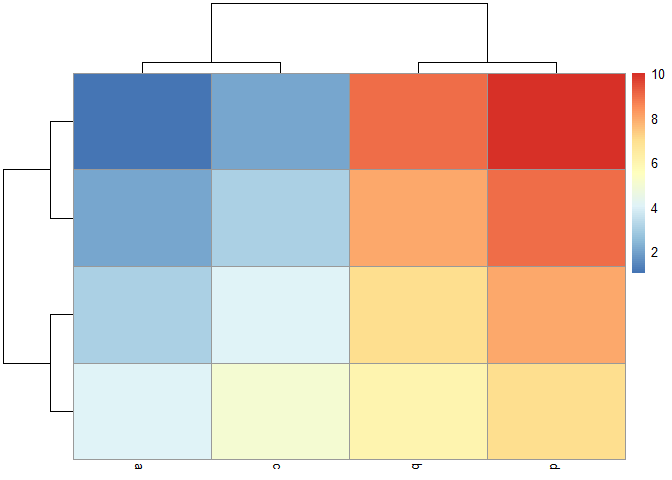
2 AFTER CLUSTERING/ in my example above, the hierarchical clustering algorithm says that a is similar to c, and b is similar to d, but the order within each group is arbitrary. You can use the callback argument to set the order within each cluster. For example, if I want columns to be ordered by their mean (highest to lowest) within each cluster:
my_callback <- function(hc, mat){
  as.hclust(reorder(as.dendrogram(hc), wts = order(rowMeans(mat), decreasing = TRUE)))
}

pheatmap::pheatmap(mat = my_mat, clustering_callback = my_callback)
You can find more examples of callback functions in the help page ?pheatmap, but mostly it all depends what you're trying to show.