Hello there. I need some assistance to obtain a PCA graph. I've been following an online tutorial to build it with 'FactoMineR' and 'factoextra' packages. In this tutorial since the beginning I worked with numerical data of my main data and those were assigned with this command line:
numerical_data <- my_data[,3:62]
Here the command doesn't take in consideration non numerical data. In my main data the first two columns are classification criteria with text only. I continued following the tutorial and I got a PCA graph with my numerical data but without the grouping I need. This was the command line I used for the graph:
fviz_pca_var(data.pca, col.var = "black")
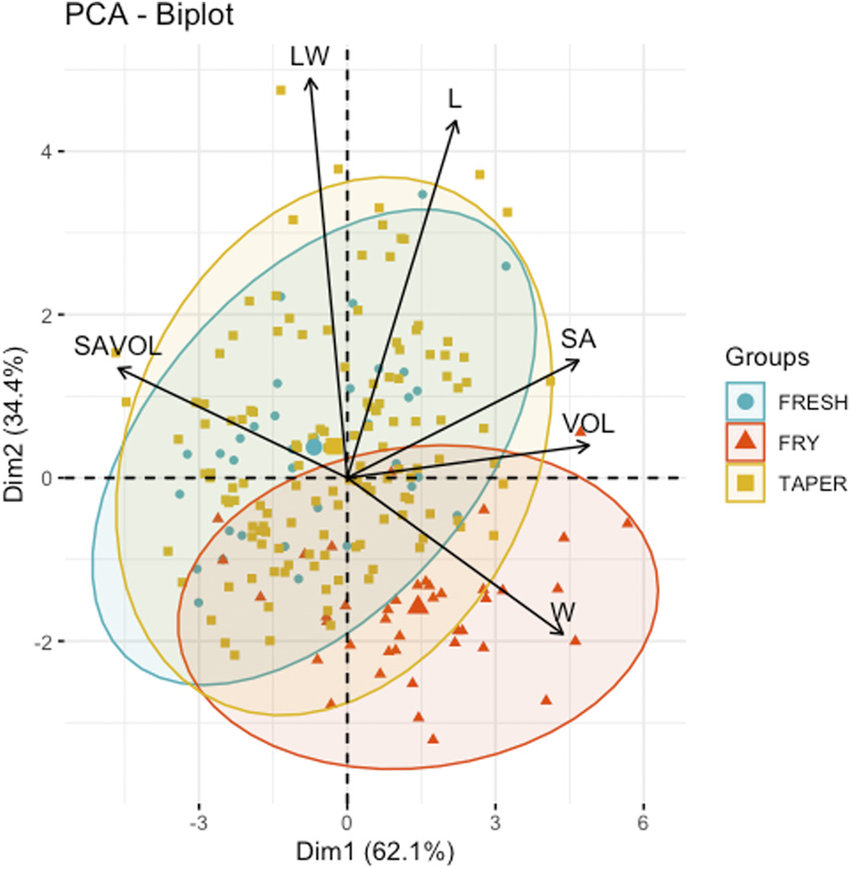
Now I want to know what command line I need to use to add the groupings to the graph, or if I need to start over including my grouping column. I'll upload a google image (I don't own the rights of it) of how I want to be grouped.