I need help understanding how to use the despike function from the photobiology package. The documentation can be found here: despike function - RDocumentation.
This is the plot of my data with a time series on the x-axis and the water level height on the y-axis. The peaks are the rise and fall of the water height due to the tide. I am attempting to use the despike function in order to eliminate the tide peaks and smooth out the hydrology baseline.
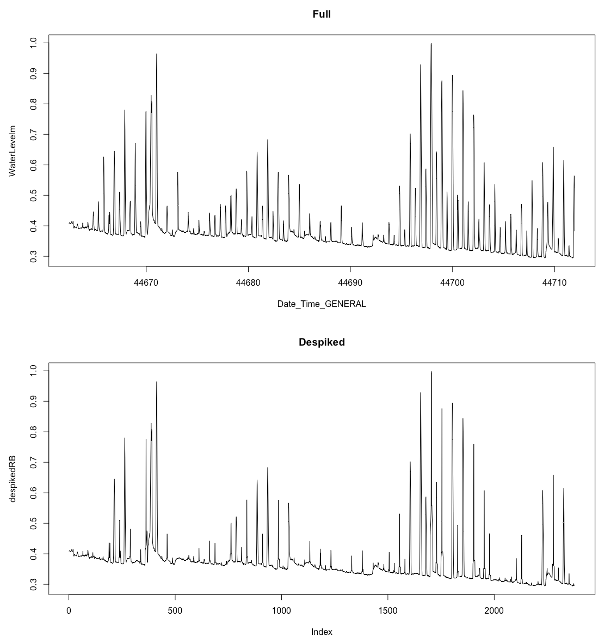
despikedRB <- despike(RB$WaterLevelm, z.threshold = 3, window.width = 11)
plot(despikedRB, type='l', main = "Despiked")
This is the closest despiking I can get, but I'm just randomly pulling in parameter values and I'm not understanding what I'm doing.
Any suggestions and explanation of the function would be greatly appreciated! I apologize that I cannot include my dataset - It is thousands of rows long.