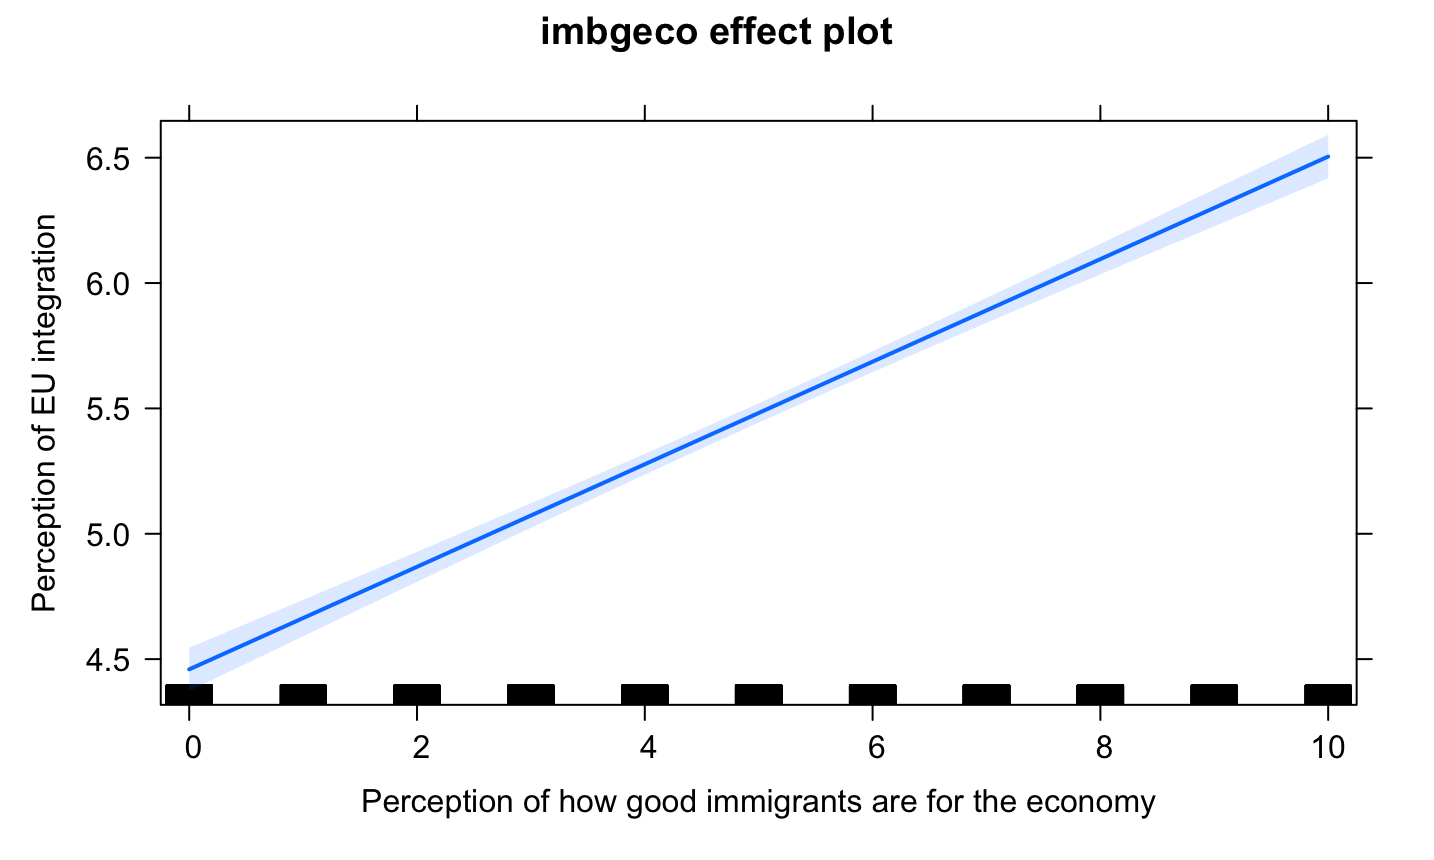
Hi all, I'm having problems with both getting rid of the black bars and why I can't have a y and x axis going to 10. Any help would be appreciated.
reg.4 <- lm(euftf ~ imbgeco + trstep + keydec + stfeco, data = ess.data.sub2)
eff.reg.4 <- effect(term = "imbgeco", mod = reg.4)
plot(eff.reg.4, xlab = "Perception of how good immigrants are for the economy",
ylab = "Perception of EU integration",
xlim = 10,
ylim = 10) #The xlim and ylim arguments are not working currently.
it is documented in ?plot.effects that there is a default rug=TRUE param that
display a rug plot showing the marginal distribution of a numeric predictor;
so do
plot(eff.reg.4, xlab = "Perception of how good immigrants are for the economy",
ylab = "Perception of EU integration",
xlim = 10,
ylim = 10,
rug  = FALSE)