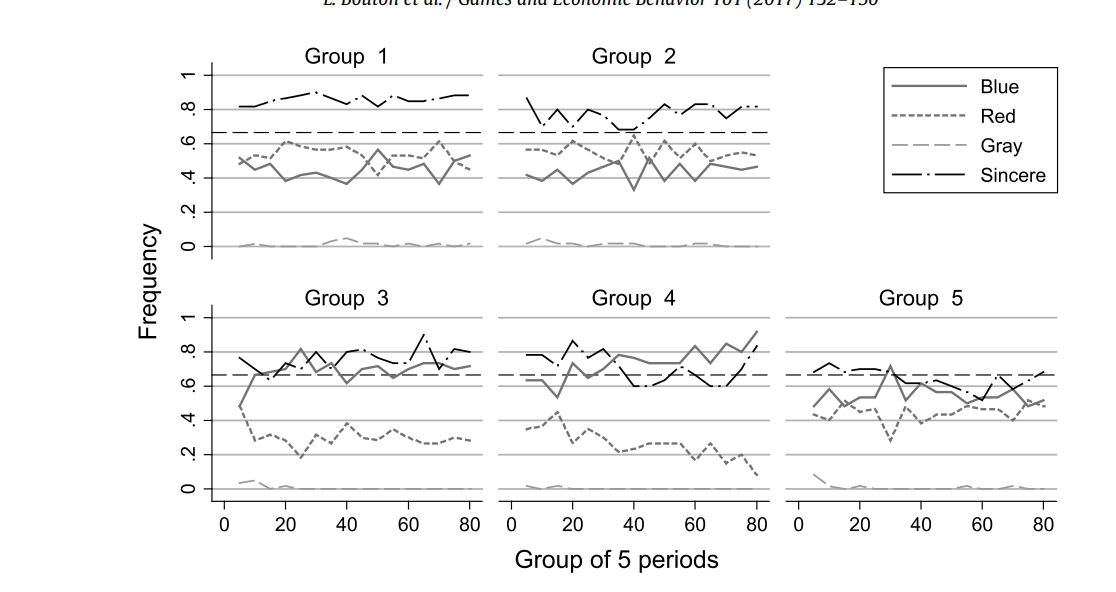
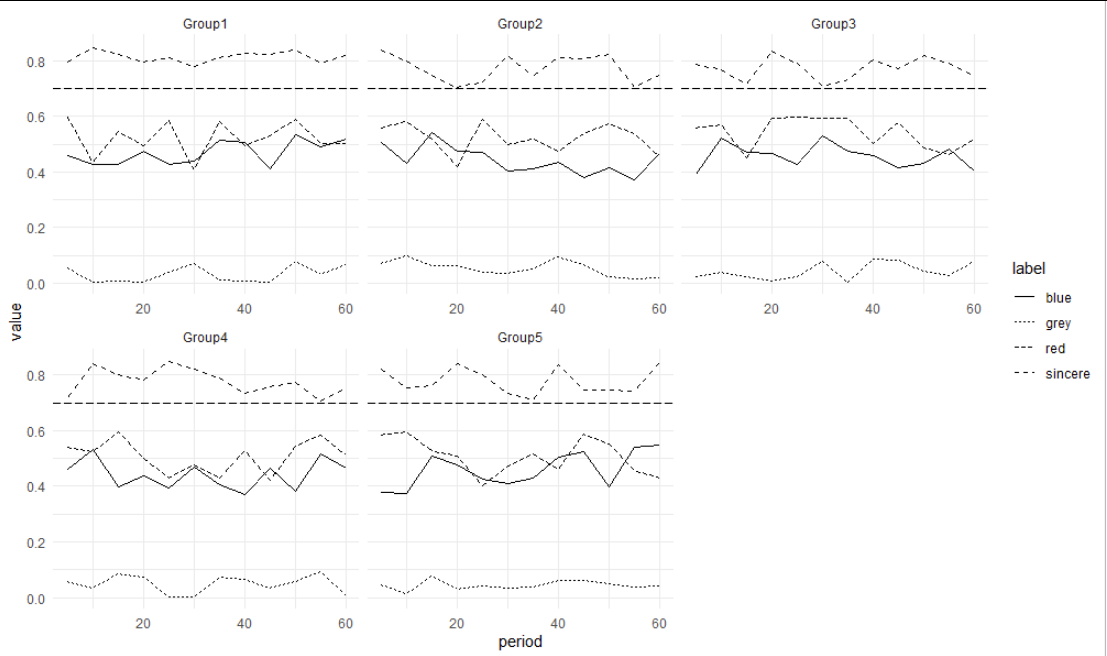
Well basically this is just a multiplet lineplot, with different lines and a facetting over the 5 groups.
# generate some similar fake data
  value = c(runif(60, 0.7, 0.85),  # sincere
            runif(60, 0.4, 0.6),    # red
            runif(60, 0.37, 0.55),  # blue
            runif(60, 0, 0.1))      # grey

  period = rep(c(1:12,
                 1:12,
                 1:12,
                 1:12),
              each = 5)

  label = rep(c(rep("sincere", 12),
                rep("red", 12),
                rep("blue", 12),
                rep("grey", 12)),
              each= 5)

  group = rep(c("Group1", "Group2", "Group3", "Group4", "Group5"), 48)

# combine everything into a dataframe
df = data.frame(label, group, label, "period" = period*5, value)

# make the plot
ggplot(df) +
  # draw the lines
  geom_line(aes(x = period,
                y = value,
                linetype = label)) +
  # add additional horizontal line
  geom_hline(yintercept = 0.7, linetype = "longdash") +
  # split into multiple plots by group
  facet_wrap(~ group, scales = "free_x") +
  # modify the theme
  theme_minimal()
1 Like
This topic was automatically closed 21 days after the last reply. New replies are no longer allowed.
If you have a query related to it or one of the replies, start a new topic and refer back with a link.