I have this problem bellow when I try to deploy my shinyapp.
The image shows when I finisih the first attempt to deploy the app.
The problem is that each chart from the grid is not displayed properly (see the image bellow)
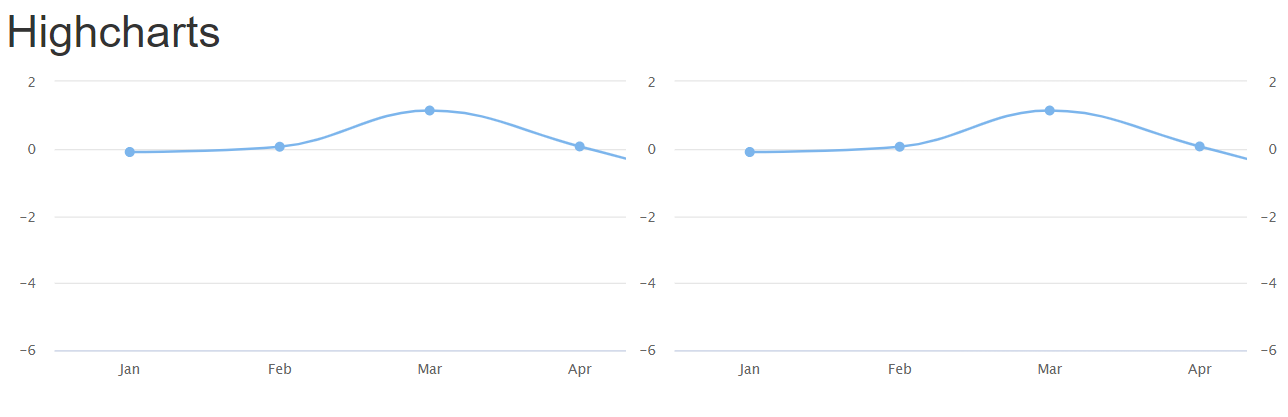
But, when I refresh or change mannualyy the width/height of the browser the chart correts itself.
Bellow is the code:
library(shiny)
library(highcharter)
library(tidyverse)

df <-tibble(months = month.abb, value = ts(cumsum(rnorm(100)))[1:12]  )

ui <- fluidPage(

  h1("Highcharts"),
  htmlOutput('chart_grid')

)

server <- function(input, output, session) {

  output$chart_grid<- renderUI({

    charts <- lapply(1:9, function(x) {

    highchart() %>%
        hc_add_series(type = 'spline',data = df, hcaes(x = months,y = value))%>%
        hc_xAxis(categories = df$months)
    })

      hw_grid(charts, rowheight = 300,add_htmlgrid_css = TRUE)%>%
        htmltools::browsable()

})
}

shinyApp(ui, server)
How do I fix this problem to have on the first attempt the highchart grid displayed properly?