Hi, how to make it so that the indicators are not divided into white, gray and black parts? (left side)
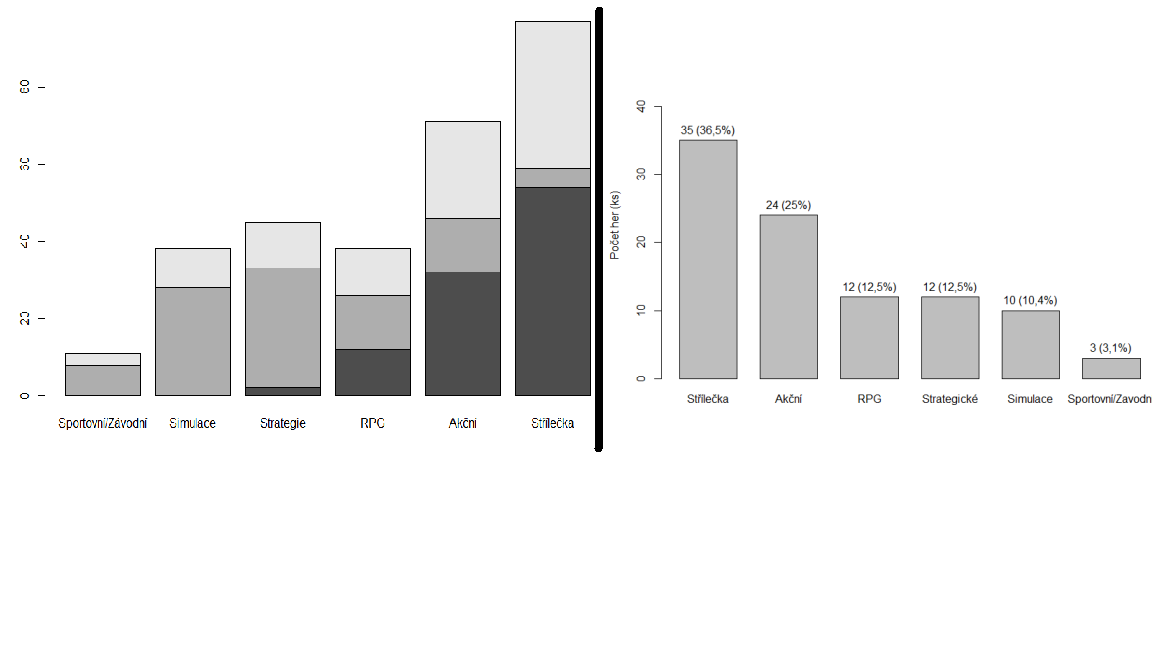
And how to do histogram like in right side?
Thanks so much!
Hi, how to make it so that the indicators are not divided into white, gray and black parts? (left side)
And how to do histogram like in right side?
Thanks so much!
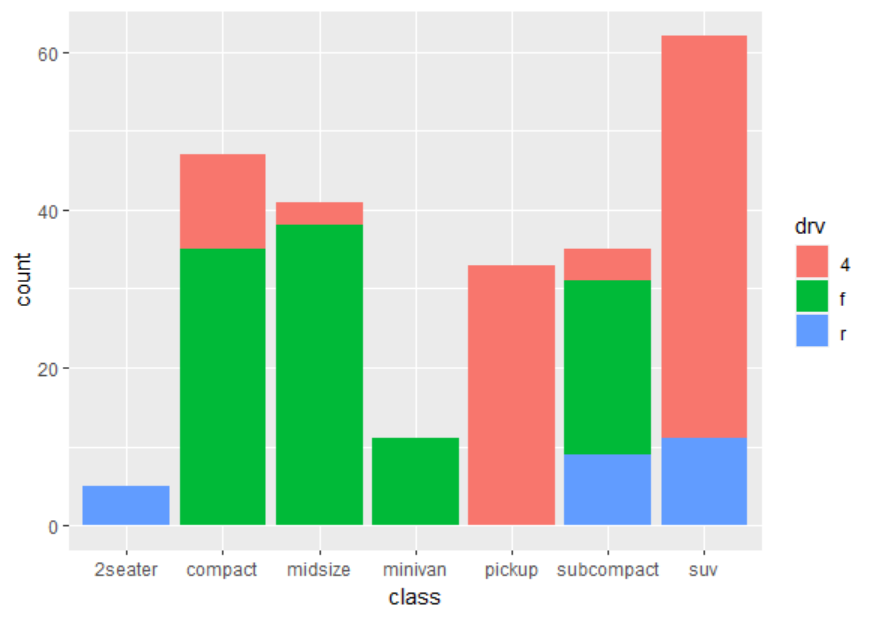
g <- ggplot(mpg, aes(class))
g + geom_bar(aes(fill = drv)) # coloured
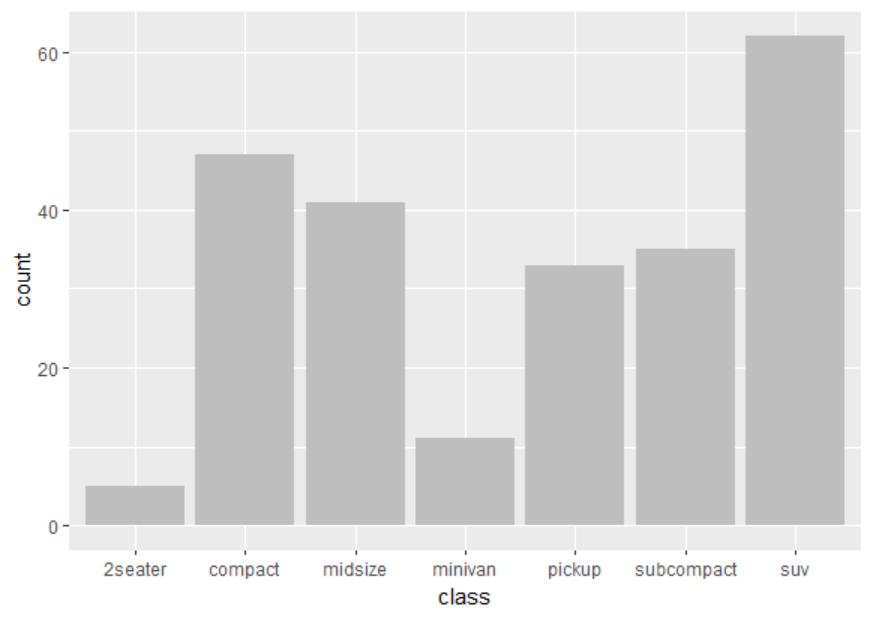
#identify number of colours :
 (numcols <- length(unique(mpg$drv)))

#make them all gray
(mycols <- rep("grey",numcols))
g + geom_bar(aes(fill = drv)) +
  scale_fill_manual(values = mycols)+
  theme(legend.position = "none")
This topic was automatically closed 7 days after the last reply. New replies are no longer allowed.
If you have a query related to it or one of the replies, start a new topic and refer back with a link.