This is how to use ggrepel with your sample data, please notice the way I'm posting my answer, that would be a proper reprex, if you are going to keep asking questions on the community is better if you put a little effort on following the reprex guide so you can make your examples this way.
library(ggfortify)
library(ggplot2)
library(ggrepel)
chi <- structure(list(Taxon = c("Andesiops", "Meridialaris", "Polycentropus",
"Austrelmis", "Prionocyphon", "Neoplasta", "Gigantodax", "Simulium",
"Tipula", "Alotanypus", "Pentaneura", "Corynoneura", "Cricotopus",
"Tanytarsus", "Podonomus", "Podonomopsis", "Parochlus"), MOPF = c(75,
5, 20, 93, 40, 98, 65, 30, 30, 60, 35, 15, 90, 95, 25, 85, 95
), MA = c(25, 95, 0, 7, 0, 2, 15, 65, 0, 20, 5, 85, 10, 5, 75,
15, 5), RA = c(0, 0, 80, 0, 60, 0, 20, 5, 0, 20, 60, 0, 0, 0,
0, 0, 0), TV = c(0, 0, 0, 0, 0, 0, 0, 0, 70, 0, 0, 0, 0, 0, 0,
0, 0), GT = c("detritívoro", "herbívoro", "depredador", "detritívoro",
"depredador", "detritívoro", "detritívoro", "herbívoro", "herbívoro",
"detritívoro", "depredador", "herbívoro", "detritívoro", "detritívoro",
"herbívoro", "detritívoro", "detritívoro")), class = "data.frame", row.names = c("Andesiops",
"Meridialaris", "Polycentropus", "Austrelmis", "Prionocyphon",
"Neoplasta", "Gigantodax", "Simulium", "Tipula", "Alotanypus",
"Pentaneura", "Corynoneura", "Cricotopus", "Tanytarsus", "Podonomus",
"Podonomopsis", "Parochlus"))
rownames(chi)<- chi$Taxon
chicucha<- chi[c(2, 3, 4, 5)]
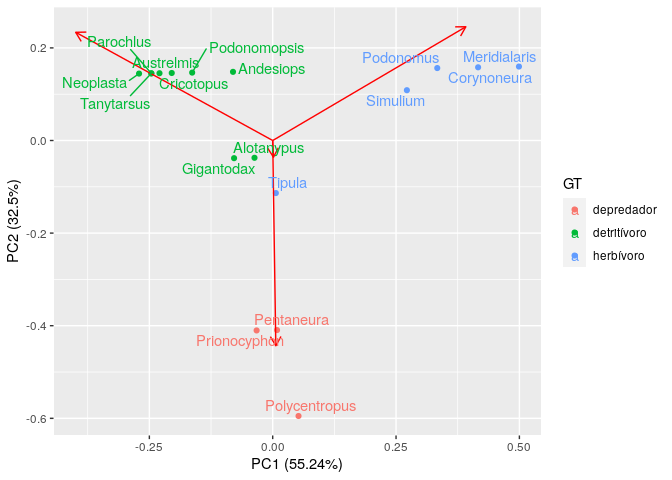
autoplot(prcomp(chicucha), data = chi, colour = 'GT', loadings = TRUE) +
geom_text_repel(aes(label = Taxon, color = GT))
Created on 2020-03-05 by the reprex package (v0.3.0.9001)